


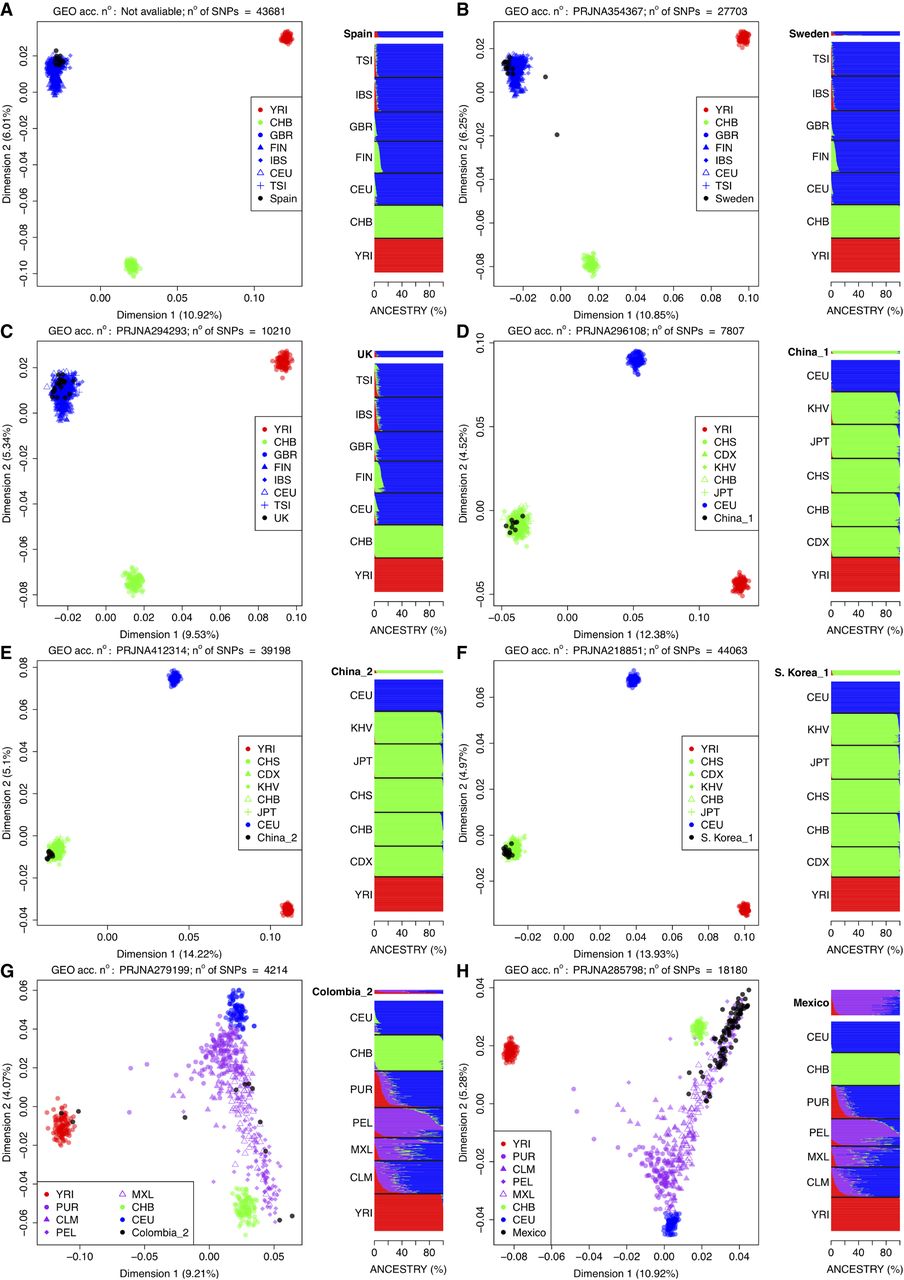
MDS plots and ancestry analysis for each of the eight data sets that overcome all the quality filters; their GEO ID numbers are indicated on top of each MDS analysis together with the number of SNPs involved in each analysis. In the admixture barplots (right) the label of the test population is bolded and their ancestral memberships barplots slightly separated from the barplots of the reference continental populations (from 1000G). (A) Spain; (B) Sweden (GEO acc. no: PRJNA354367); (C) UK (GEO acc. no: PRJNA294293); (D) China_1 (GEO acc. no: PRJNA296108); (E) China_2 (GEO acc. no: PRJNA412314); (F) Korea_1 (GEO acc. no: PRJNA218851); (G) Colombia_2 (GEO acc. no: PRJNA279199); and (H) Mexico (GEO acc. no: PRJNA285798).




