


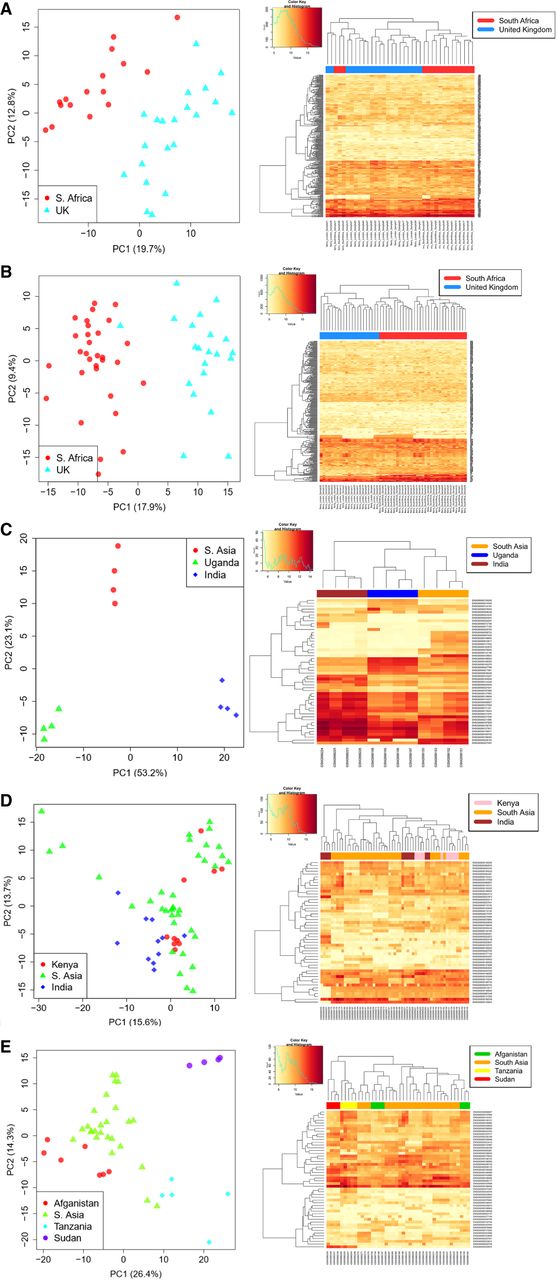
Analysis of gene expression patterns in two case studies where information on ethnicity was available, indicating that ethnicity status per se impacts gene expression patterns. For each study, we show a PCA plot (right) built with the most highly expressed genes between ethnic groups and using the Deseq function “plotPCA,” while the heatmaps were built using a minimum subset of the most highly expressed genes (including all is not possible because of space limitations) that allowed to visualize different patterns between population sets (left): (A) Active TB from Berry et al. (2010), (B) latent TB from Berry et al. (2010), (C) control female group from Singhania et al. (2018), (D) control male group from Singhania et al. (2018), and (E) male TB cases from Singhania et al. (2018).




