


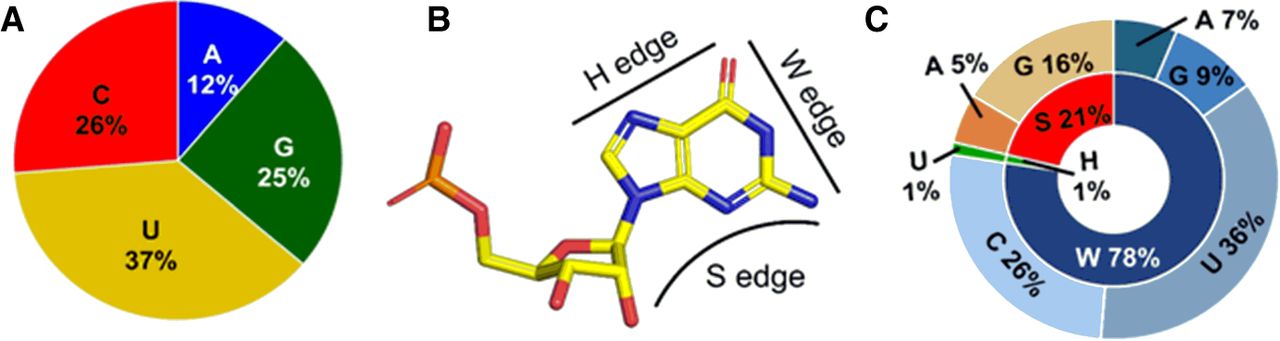
FIGURE 1.
(A) Statistical distribution of the aptamer nucleobases that interact with the ligand in riboswitches in the crystal structures. (B) Interacting edges (Watson–Crick edge [W edge]; Hoogsteen edge [H edge] and Sugar edge [S edge]) of the aptamer nucleobases. (C) Distribution of base:ligand pairs as a function of the interacting edge (inner circle) and the aptamer base (outer circle).




