


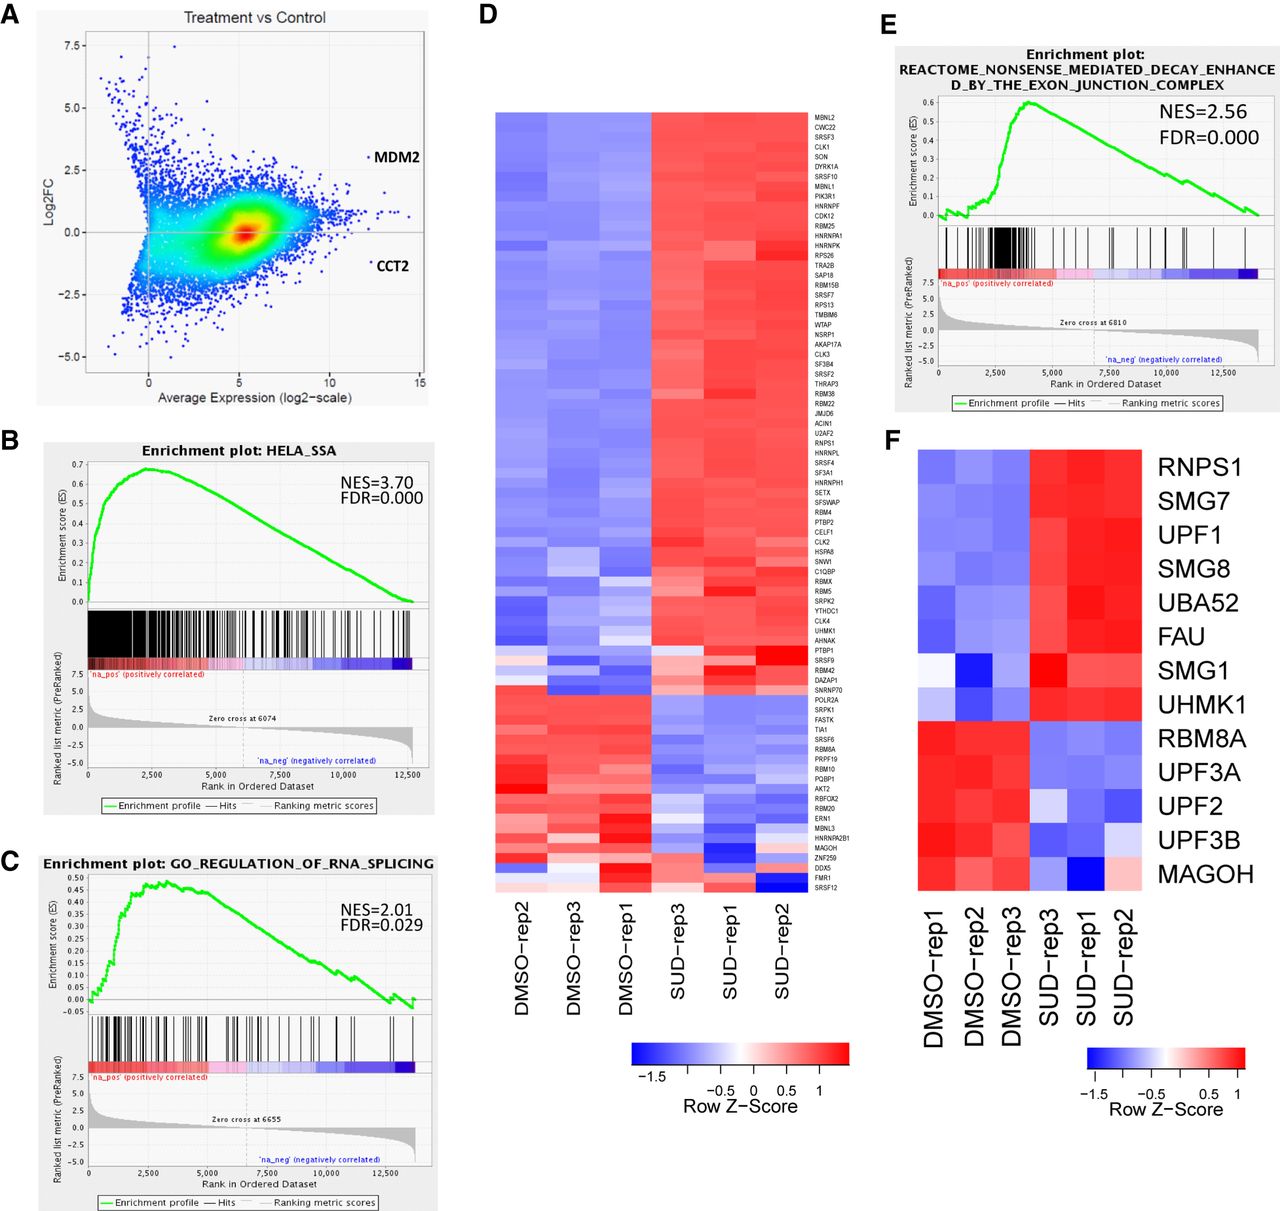
Differential gene expression analysis in Rh18 cells following sudemycin D1 treatment. (A) An M-A (log2 fold change versus average expression) plot indicating the wide range of changes in gene expression following drug exposure. (B) GSEA analyses demonstrate significant normalized enrichment scores for up-regulated genes in spliceostatin A-treated HeLa cells. (C) GSEA analyses indicating increased expression of genes involved in RNA splicing. (D) Heatmap of genes involved in tRNA-splicing (defined by GO:0043484, M16816). (E) GSEA analyses demonstrating increased expression of genes involved in nonsense-mediated decay (NMD). (F) Heatmap of key genes involved in the NMD pathway (defined by REACTOME R-HSA-975957, M1067).




