


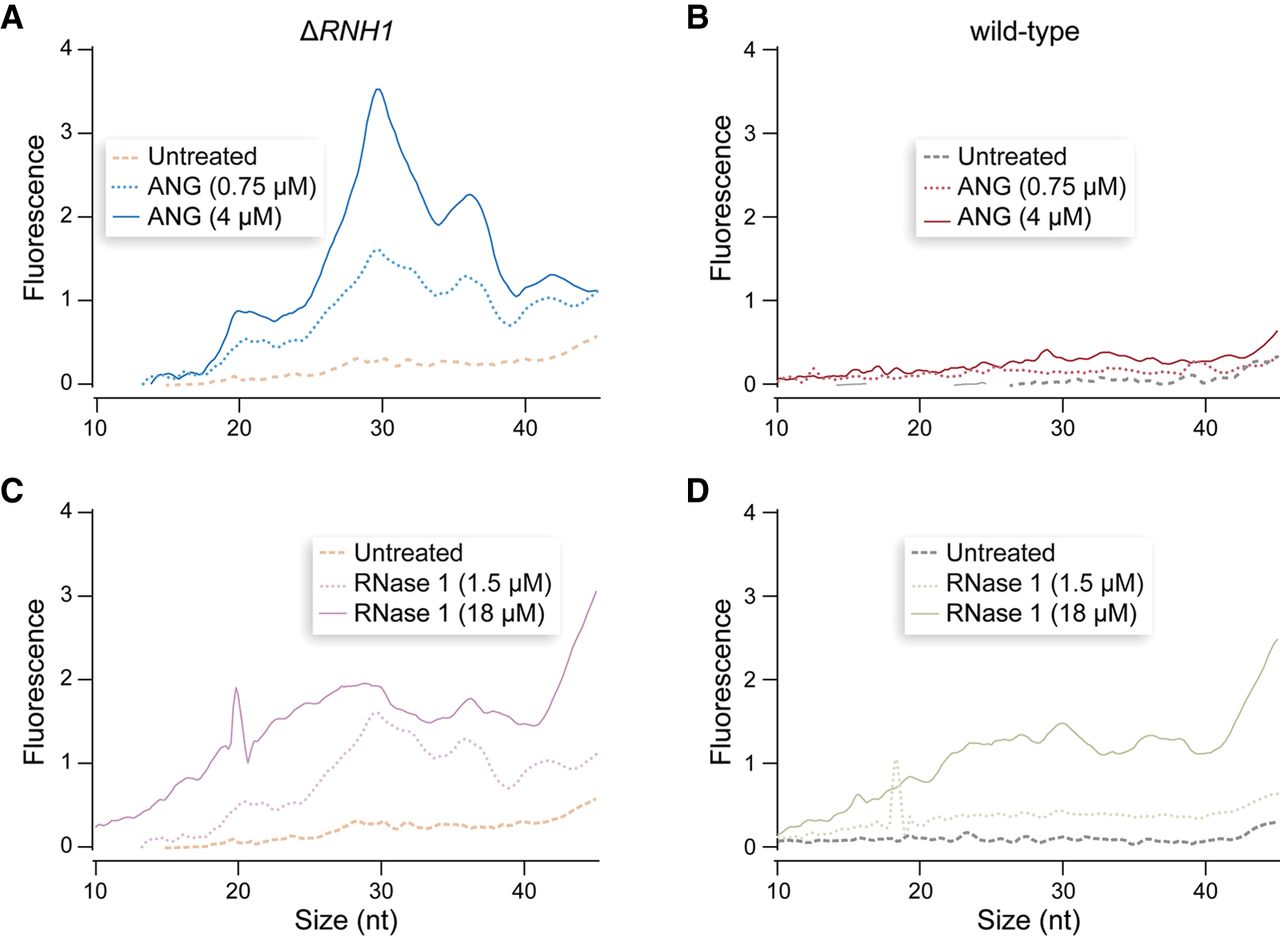
FIGURE 2.
Graphs showing the effect of ptRNase-treatment on small RNAs (10–50 nt) in wild-type and ΔRNH1 HeLa cells. (A) ANG-treated ΔRNH1 cells. (B) ANG-treated wild-type cells. (C) RNase 1-treated ΔRNH1 cells. (D) RNase 1-treated wild-type cells.




