


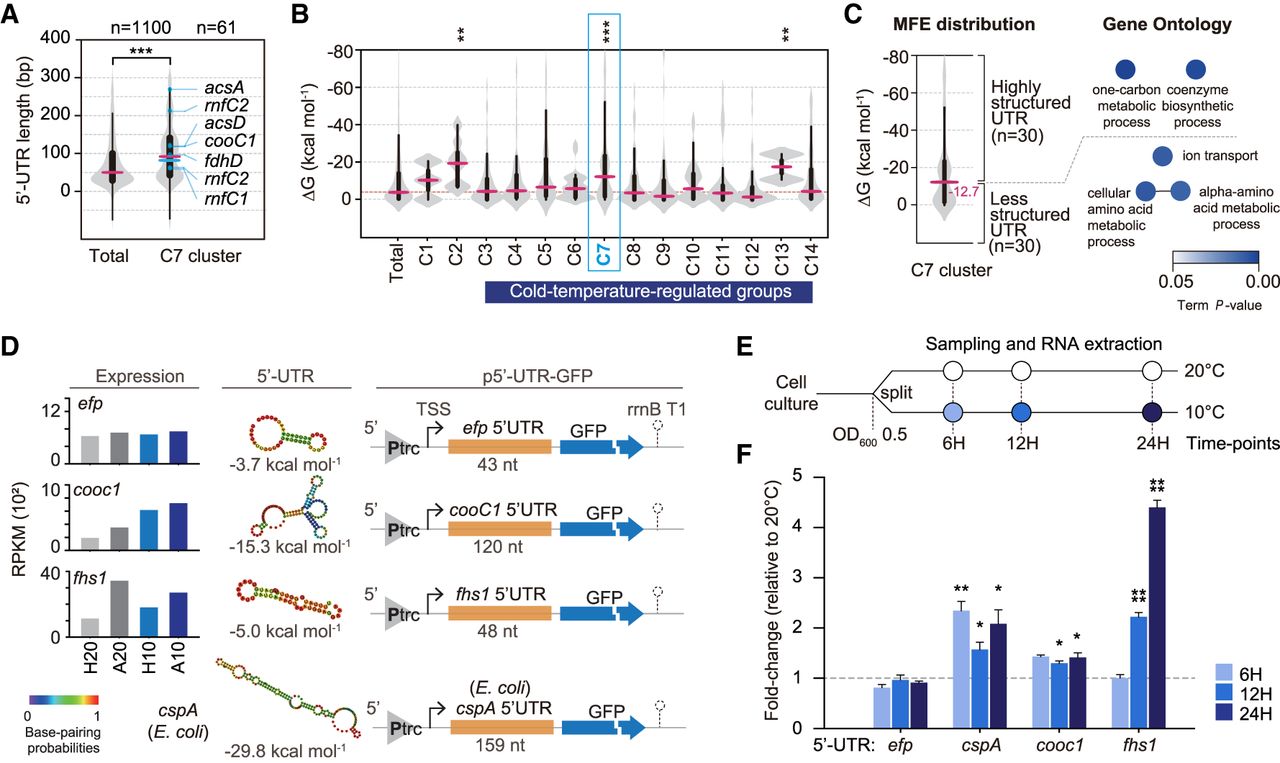
Low-temperature-responsive 5′-UTRs control the expression of acetogenesis-associated genes. (A) Comparison of the length distributions of 5′-UTRs between the total and C7 groups. The significance of differences was assessed by the Wilcoxon-Mann-Whitney test (***, P < 0.001). See also Supplemental Figure S6. (B) Comparison of the minimum folding free energy (MFE) distribution between the groups of DEG. Violin plots show median and quartile ranges of calculated MFEs. Secondary structures of a representative set of the mRNAs were predicted using the ViennaRNA RNAfold (Lorenz et al. 2011). The significance of differences was assessed by the Wilcoxon-Mann-Whitney test (**, P < 0.01; ***, P < 0.001). (C) Minimum folding free energy (MFE) distribution of C7 group and their Gene Ontology term enrichment analysis. Violin plots show median and quartile ranges of calculated MFE. Secondary structures of a representative set of the mRNAs were predicted using ViennaRNA RNAfold software. Enriched GO terms, including biological process, molecular function, and cellular component, were represented together as nodes. A Bonferroni-corrected P < 0.05 was considered the cut-off criterion. Term enrichment significance is represented by color. (D) Design of plasmid-based reporters for characterization of regulatory 5′-UTR regions. (Left panel) The transcriptional level of the efp, cooc1, and fhs1 genes under the four growth conditions; (middle panel) secondary structure of each 5′-UTR. Structure and MFE were predicted using the ViennaRNA RNAfold software. (Right panel) Schematic illustration of the reporter gene constructs. Each segment of the gene 5′-UTRs of genes was fused to GFP under the constitutive trc promoter. Yellow boxes represent the specific mRNA 5′-UTRs. The sequence for the 5′-UTR of cspA was obtained from the genome of E. coli strain MG 1655 (NC_000913.3). (E) The assay design is shown. (F) Assays of 5′-UTR of efp, cooc1, fhs1, and cspA at 10°C and 20°C, respectively. The graph shows fold-changes in the GFP transcript abundance. Each value is the mean of three replicates in independently repeated experiments, and error bars show ±SEM. The gyrA gene was used as the reference (*) P < 0.05; (**) P < 0.01; (****) P < 0.0001 (Student's unpaired t-test).




