


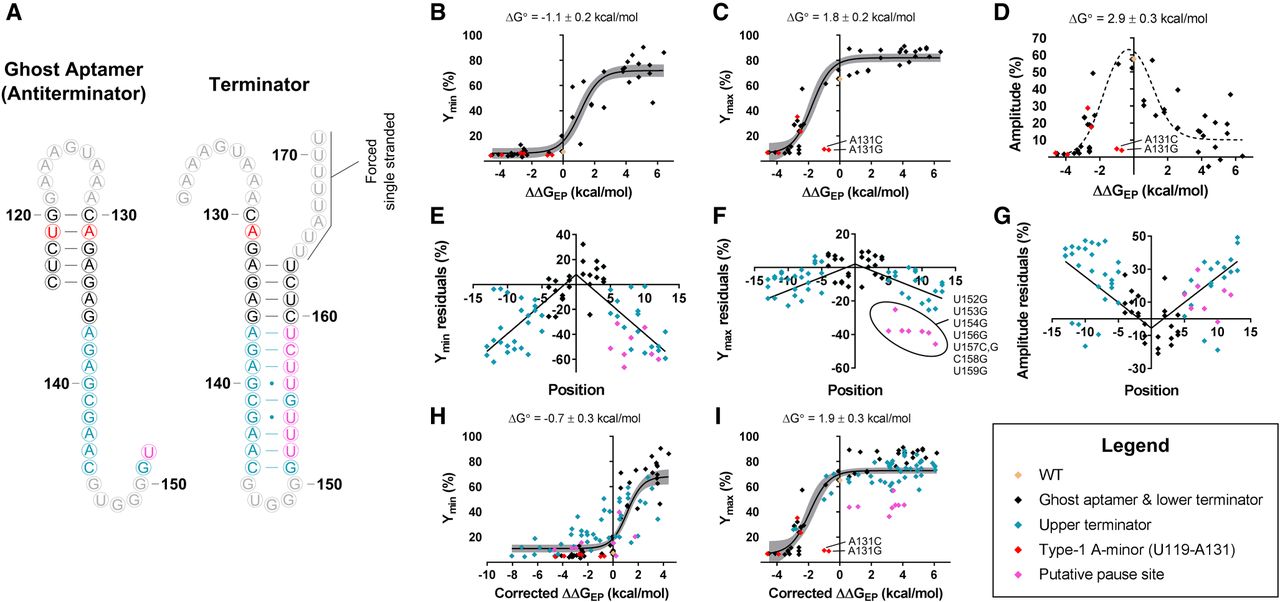
Dependence of readthrough efficiencies on ΔΔGEP. (A) Predicted secondary structures for the antiterminator and terminator sequences used in the free energy calculations of ΔΔGEP. Nucleotides are colored according to plots B–I. Correlations are shown between ΔΔGEP and Ymin (B), Ymax (C), and amplitude (D). Only data associated with WT and mutations within the base-pairing regions of the ghost aptamer or the first four base pairs of the terminator hairpin were considered for the fits displayed in B–D. Red diamonds indicate nucleotides that are expected to participate in a type-1 A-minor interaction. These data were excluded from all fits as energetic contributions from tertiary interactions are not accounted for in the free energy calculations of ΔΔGEP. Correlations between the positional distance of a mutation from the base of the terminator stem and the associated residuals (based on the fits depicted in B–D) are shown for Ymin (E), Ymax (F), and amplitude (G). A linear dependence was observed and a correction term was added to the model to account for this dependence. Fits obtained with the updated model are shown for Ymin (H) and Ymax (I). The gray bands in B, C, H, and I are the 95% confidence intervals for the displayed fits. The dotted line shown in D depicts the difference between the Ymin and Ymax fits depicted in B and C.




