


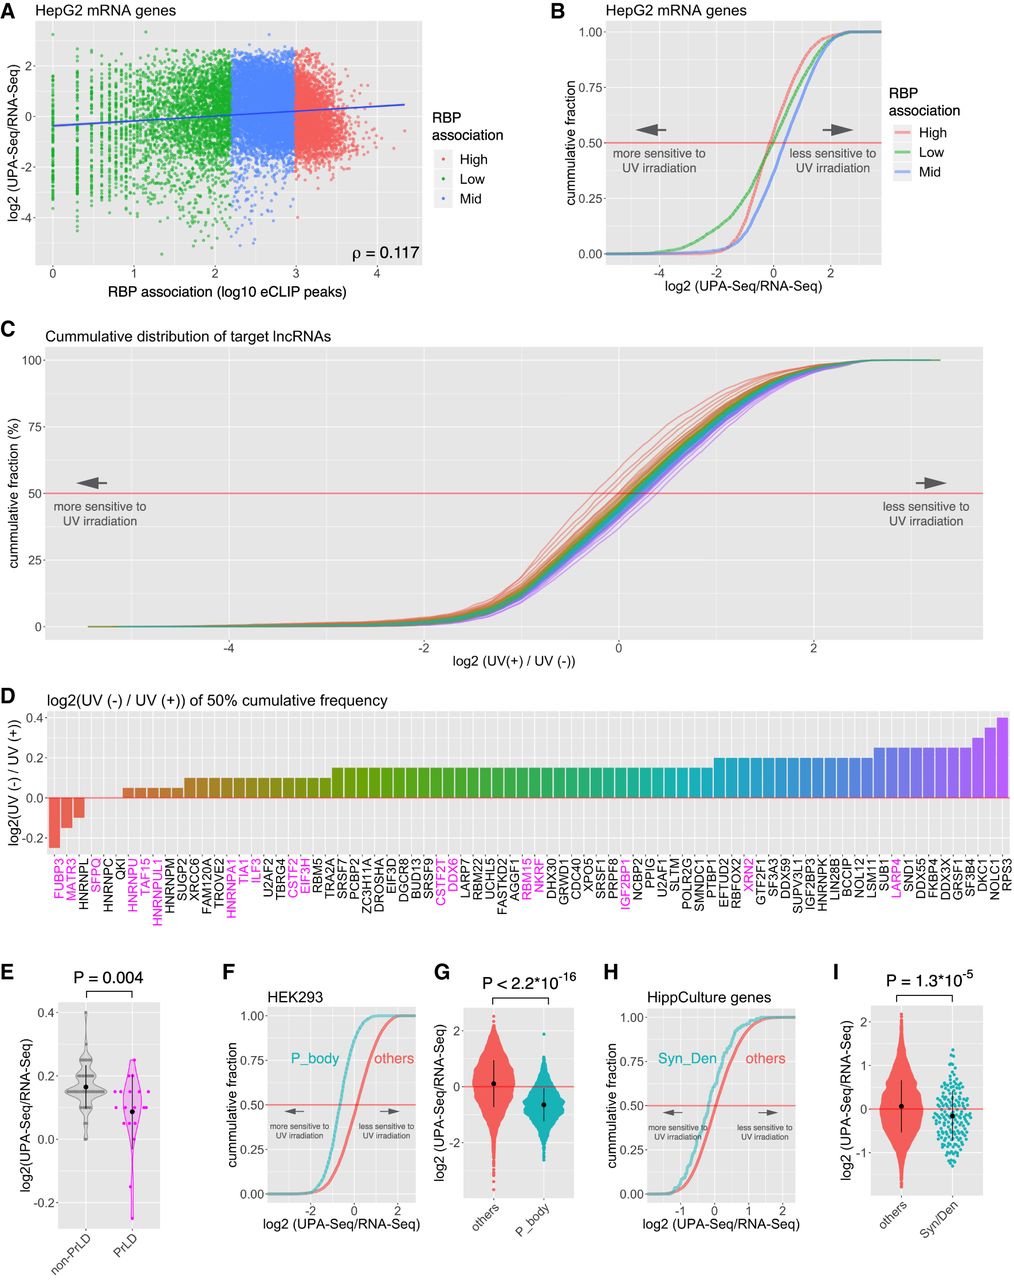
mRNAs localizing to P-bodies and synapses exhibit decreased reads in UPA-seq. (A) Scatter plot illustrating the relationship between the total number of eCLIP peaks mapped on each transcript and the fold change of reads upon UV irradiation. The blue line represents the regression line. (B) Cumulative distribution of mRNAs that possessed high (top 25% quintile, red), middle (25–75 percentile, blue), and low (bottom 25% quintile, green) total eCLIP peaks for each RBP along the fold change of reads upon UV irradiation. (C) Cumulative distribution of mRNAs bound by the series of RBPs shown in D along with the fold change of reads upon UV irradiation. (D) Bar plots illustrating the fold change of reads mapped to mRNAs at the median targeted by each RBP. The magenta color represents RBPs containing PrLD. (E) Violin and quasi-random beeswarm plots showing the fold change of reads mapped to mRNAs at the median targeted by RBPs without PrLD (non-PrLD) and with PrLD (PrLD). Bar plots indicate the mean ± SD of values in each category. (F) Cumulative distribution of mRNAs enriched in P-bodies (P_body) and other mRNAs (others) along with the fold change of reads upon UV irradiation. (G) Quasi-random beeswarm plot showing the fold change of reads mapped to mRNAs that are enriched in P-bodies (P-body) and other mRNAs (other). Note that mRNAs enriched in P-bodies exhibit a greater negative fold change compared to the others. The P-value was calculated by the Wilcoxon rank sum test. (H) Cumulative distribution of mRNAs localizing at synapse/dendrite (Syn/Den) and other mRNAs (others) along with the fold change of reads upon UV irradiation. (I) Quasi-random beeswarm plot showing the fold change of reads mapped to mRNAs that localize at the synapse/dendrite (Syn/Den) and other mRNAs (other). Note that synapse/dendrite-localizing mRNAs exhibit greater negative fold change compared to others. P-value was calculated by Wilcoxon rank sum test.




