


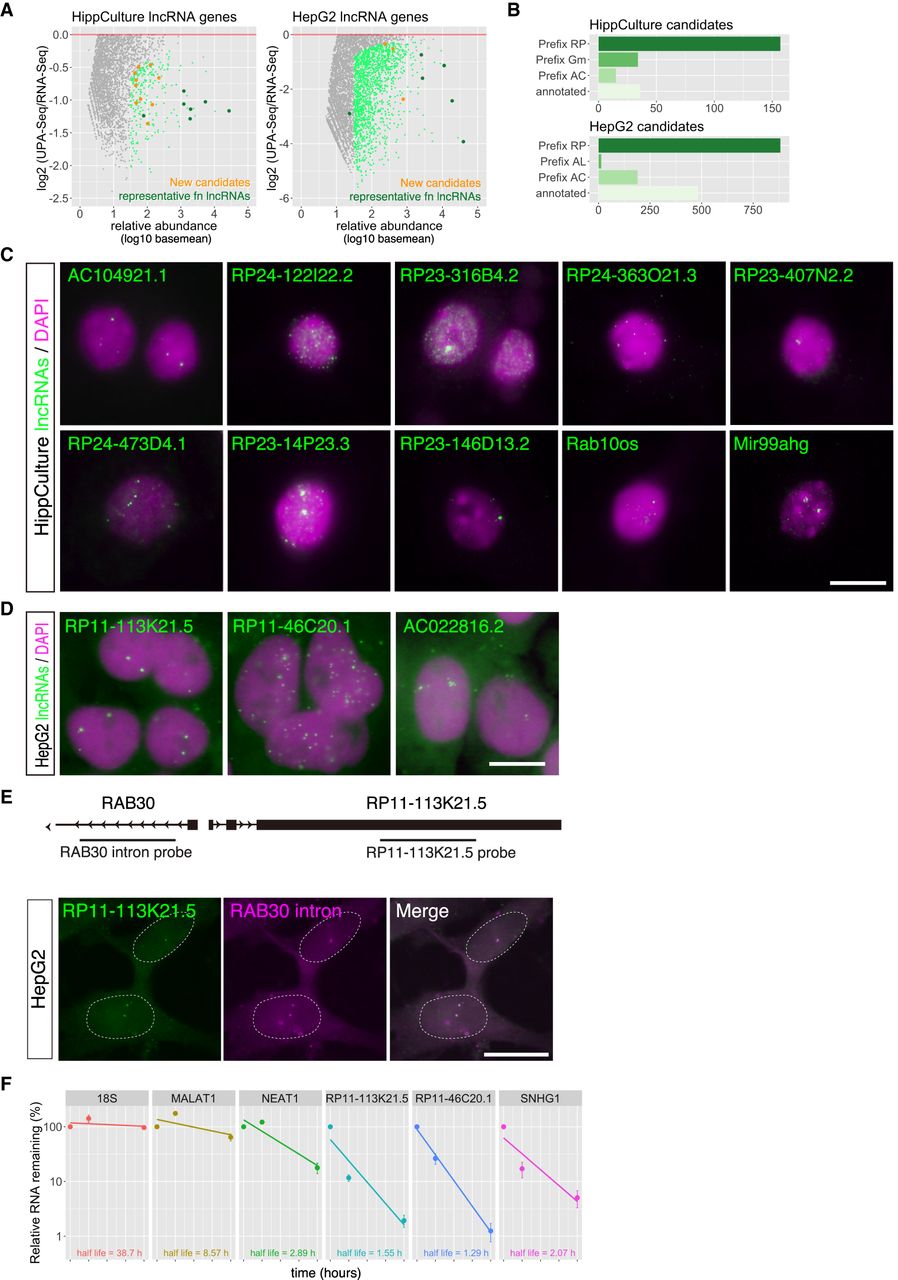
Identification of novel functional lncRNA candidates by UPA-seq. (A) MA-plot of log2 fold change of reads upon UV irradiation in HippCulture and HepG2 cells as a function of the relative abundance (log10 baseMeans). Light green dots represent lncRNAs that exhibited significant (FDR < 0.05) fold change, orange dots represent functional lncRNA candidates used for the following FISH studies, and dark green dots represent known functional lncRNAs. Note that only lncRNAs with negative log2 fold change values are illustrated. (B) Group of functional lncRNA candidates that exhibited significant decrease (FDR < 0.05) upon UV irradiation. Genes are categorized into known genes (annotated) and unknown genes assigned with ID numbers with various prefixes (RP, Gm, AC, and AL). (C,D) FISH images showing the subcellular distribution of functional lncRNA candidates (green) in HippCulture cells (C) and HepG2 cells (D). Magenta denotes nuclei counterstained with DAPI. Scale bar, 10 µm. (E) Schematic illustration showing the gene organization at the Rab30/RP11-113K21.5 locus and the positions of the probes used for simultaneous detection. Note that the signals obtained with probes that detect RP11-113K21.5 were closely associated with the signals obtained with probes that detect Rab30 intron sequences. Dashed lines represent the position of the nucleus. Scale bar, 10 µm. (F) Half-lives of 18S rRNA, MALAT1, NEAT1, RP11-113K21.5, RP11-46C20.1, and SNHG1, as measured by BRIC RT-qPCR. Note that the functional lncRNA candidates exhibited relatively short half-lives.




