


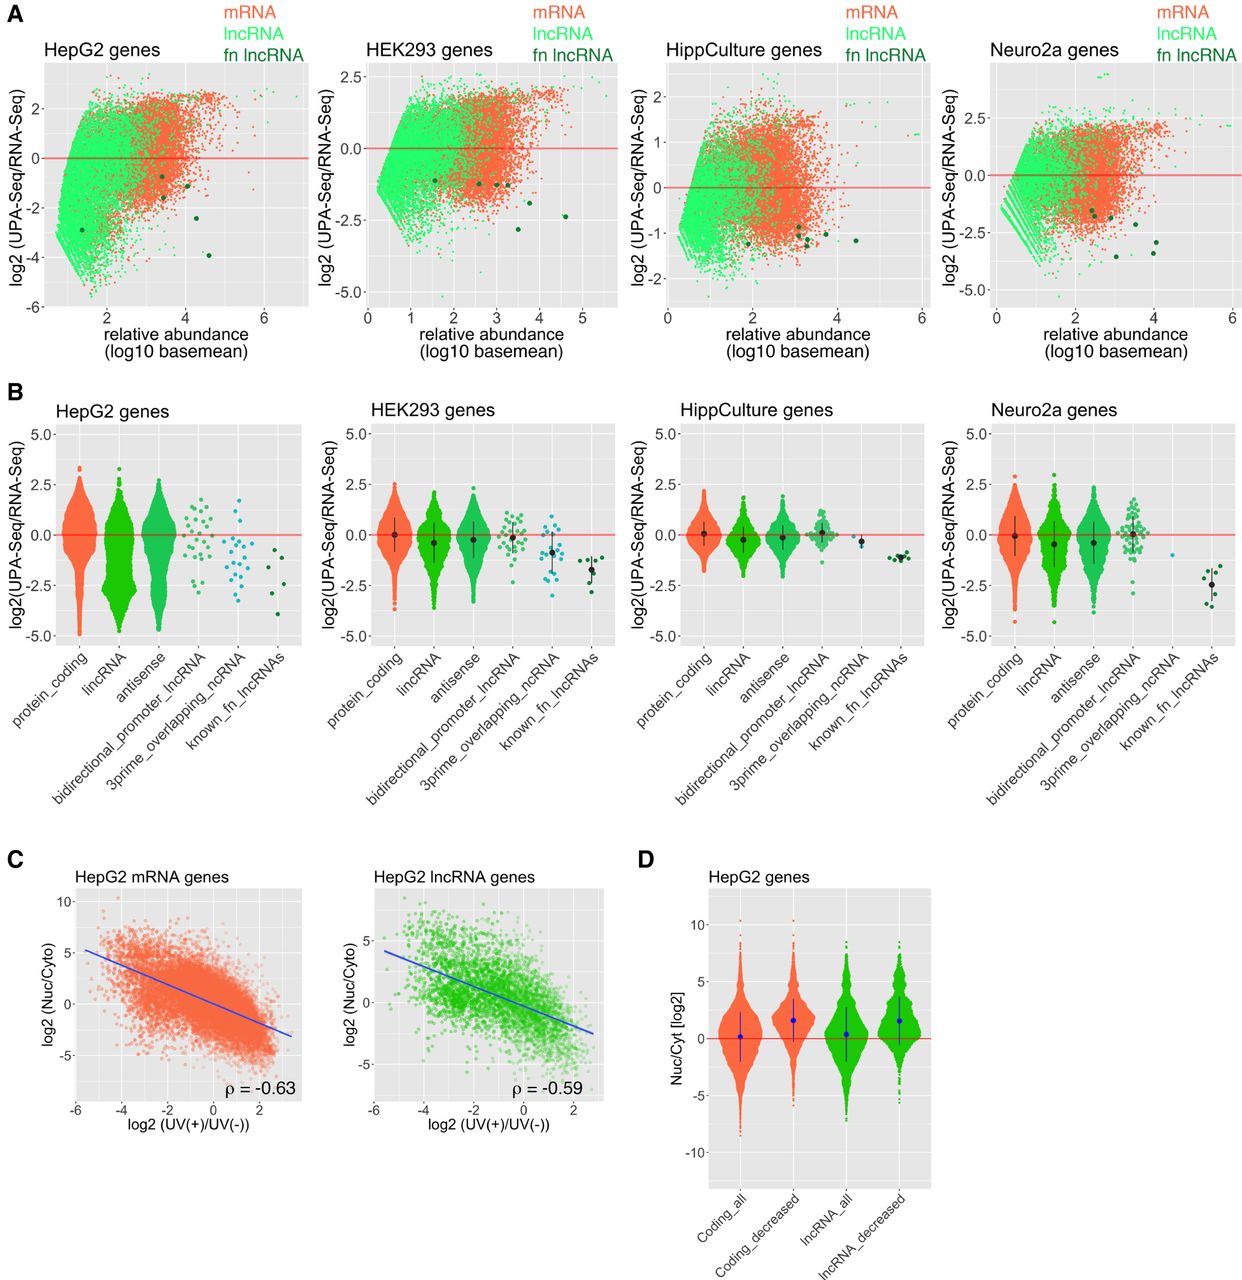
Decreased RNA-seq reads mapped to known functional lncRNAs upon UV irradiation. (A) MA-plot of log2 fold change of reads upon UV irradiation as a function of the relative abundance (log10 baseMeans) calculated by DESeq2 in HepG2, HEK293, Neuro2a, and HippCulture cells. Light green dots represent lnRNAs, coral dots represent mRNAs, and dark green dots represent known functional lncRNAs (Xist, Neat1, Malat1, Mia, NORAD, TUG1, and Cyrano). Some of the functional lncRNAs that are not expressed in each cell type are not shown in the panels. fn lncRNA: functional lncRNA. (B) Quasi-random beeswarm plots of log2 fold change of reads upon UV irradiation in HepG2, HEK293, Neuro2a, and HippCulture cells. Bar plots indicate the means ± SD of three biological triplicates. Note that lncRNAs generally exhibit negative fold change. known_fn_lncRNAs: known functional lncRNAs. (C) Scatter plots illustrating the relationship between the fold change of reads upon UV irradiation and the ratio of reads in the nuclear/cytoplasmic fractions in HepG2 cells. The correlation coefficient (ρ) was calculated by the Spearman's rank correlation analyses. (D) Quasi-random beeswarm plots of the ratio of reads in the nuclear/cytoplasmic fractions of HepG2 cells. Bar plots indicate the means ± SD of three biological triplicates. Note that the mRNAs/lncRNAs that exhibited a decrease in UPA-seq reads are preferentially enriched in the nuclear fraction.




