


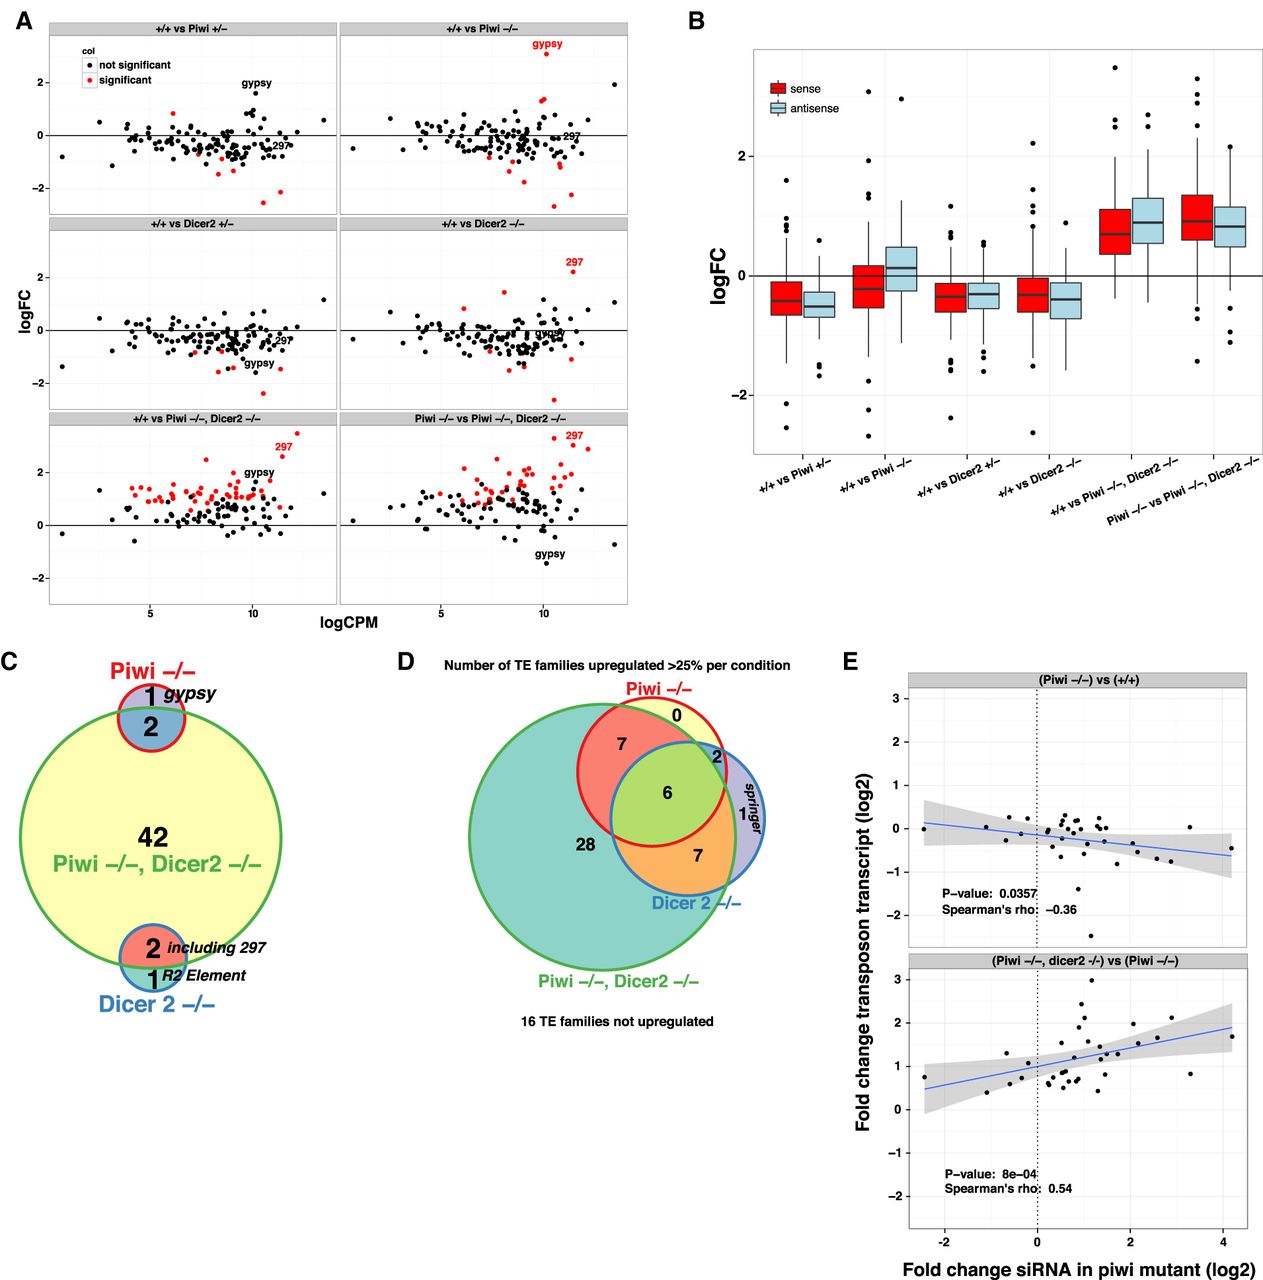
Piwi and Dicer-2 are complementary factors for the repression of TEs in adult heads. (A) Scatterplots displaying the log2 fold changes of sense TE transcript expression on the y-axis and the mean expression strength on the x-axis. Log2 fold changes were calculated between the indicated mutant and the wild-type TE levels, except in the last panel where we calculate changes between the double mutant and the piwi mutant. (B) Boxplots showing the distribution of log2 fold changes as in A, but considering changes of sense (red) and antisense TE transcripts (blue) separately for each comparison (x-axis). (C) Venn diagram showing the overlap of significantly (p.adj <0.05) up-regulated TEs for the indicated mutants as compared to the wild-type control. (D) As in C, but taking TEs whose transcript abundance increases more than 25% over the wild-type. (E) Scatterplot displaying the correlation between log2 fold changes of 21 nt antisense RNA (siRNA) in piwi homozygous mutant heads compared to wild-type heads on the x-axis and log2 fold changes of sense TE transcripts for the genotype comparisons indicated above each panel. Only TEs that passed a threshold of on average five 21 nt antisense reads (after library-wise normalization, see Materials and Methods) over all small RNA libraries were analyzed. Further, only TEs whose sense transcript level increased in piwi, dicer-2 while insensitive to piwi loss are shown. A scatterplot including all tested genotypes that depict all TEs that passed the siRNA threshold can be found in Supplemental Figure 2B. The blue line is a fit produced by the lmfit function, and the gray area delimits the corresponding confidence interval.




