


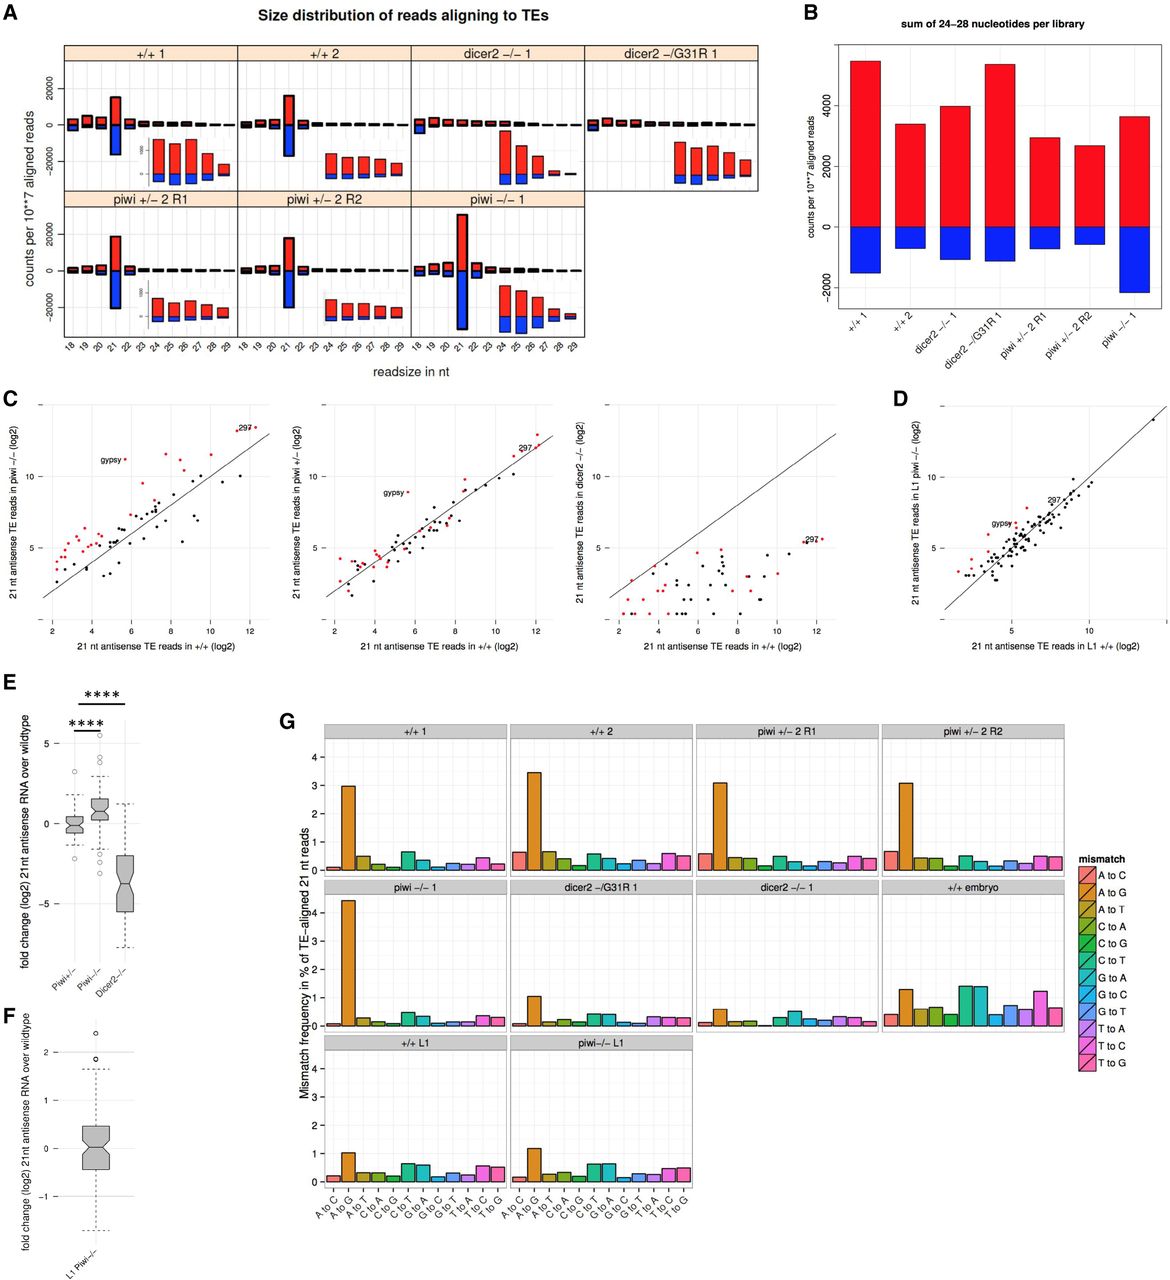
Loss of Piwi repression leads to an increase of TE-targeting siRNAs. (A) Overview of the size (x-axis) and amount (y-axis, in counts per 10 million mapped reads) of small RNA reads that align to TEs in adult heads of the indicated genotype. Zoom of the 24–28 nt fractions are shown as insets. (B) Sense or antisense reads of 24 to 28 nt were summed for each indicated genotype (x-axis). (C) Scatterplots displaying the abundance of 21 nt antisense reads in mutant (y-axis) and wild-type (x-axis) heads. Red dots in the first panel indicate the transposon-specific 21 nt antisense reads that increased more than twofold in piwi homozygous mutant heads. These dots are shown for comparison in the second and third panels. (D) same as C but for wild-type first instar larvae (homozygous piwi mutant versus wild-type). (E) Boxplots showing the distribution of 21 nt antisense fold changes (y-axis) between wild-type and the indicated mutants (x-axis). Significance of differences between the distributions was assessed with Mann-Whitney U-test. (F) As in E, but for wild-type first instar larvae (homozygous piwi mutant versus wild-type). (G) Mismatches of 21 nt reads aligning to reference genome TE insertions with one mismatch allowed. Identity of mismatch is indicated on the x-axis, and the fraction of all reads with this mismatch identity over all TE matches is indicated on the y-axis. In all panels, the index of the sample duplicate is indicated after the genotype when appropriate.




