


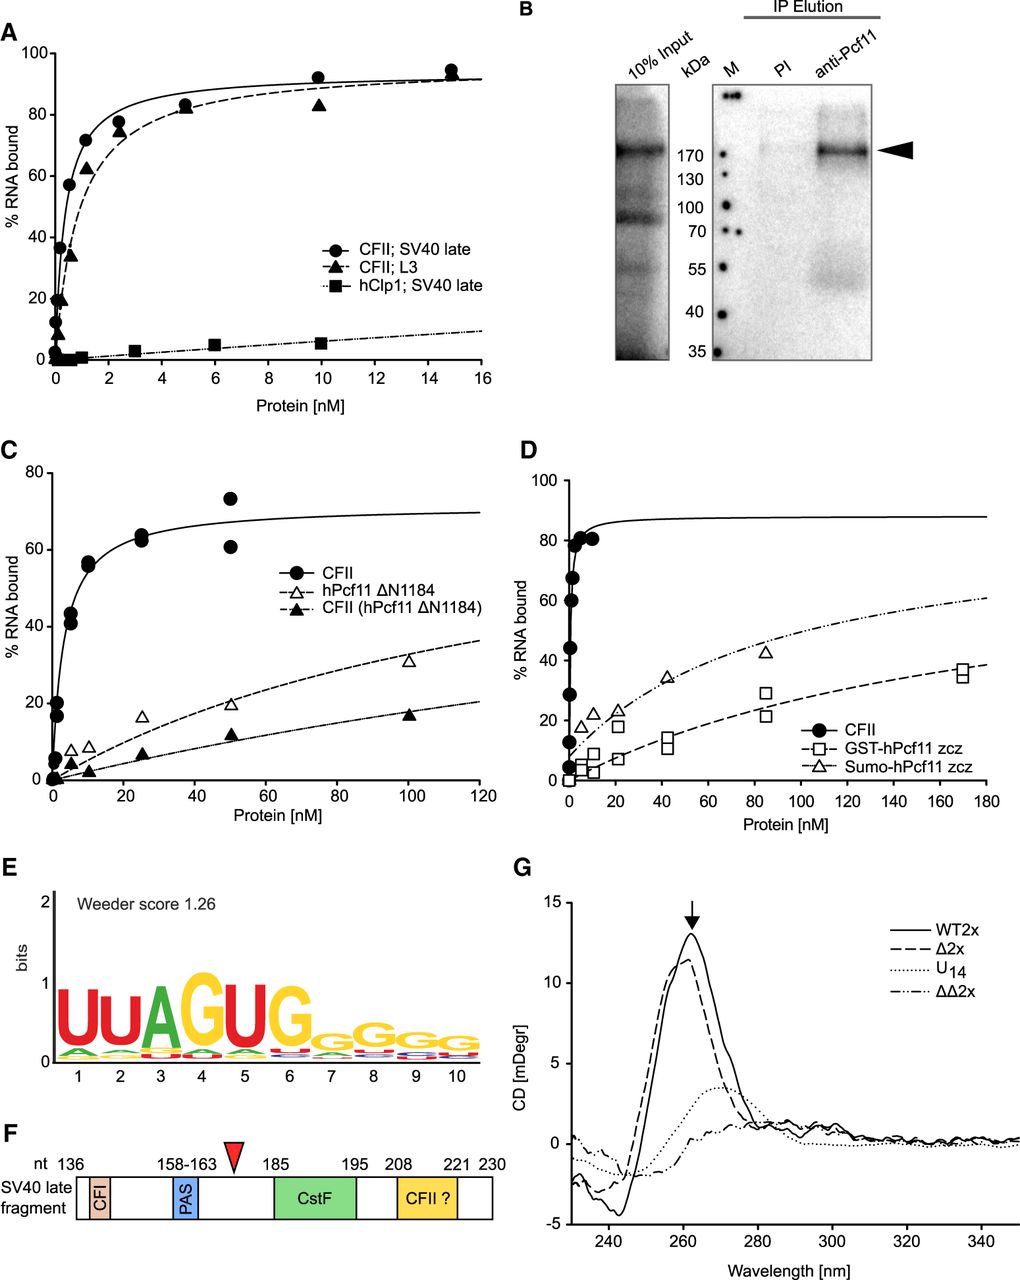
CF II binds RNA via the zinc fingers of Pcf11. (A) Nitrocellulose filter-binding experiments showing binding of CF II or hClp1 to SV40 late or L3 RNAs, as indicated. Hyperbolic fitting indicated K50 values of 0.4 nM and 0.9 nM for CF II binding to the SV40 late or the L3 RNA, respectively. The extrapolated K50 for hClp1 was ∼140 nM. However, even this relatively low RNA binding activity was at least partially due to a contamination, as indicated by analysis of the profile of the gel filtration column from which hClp1 was obtained. (B) CF II was incubated with 5′-labeled U14 and irradiated with UV light. An aliquot of the cross-linked material was then subjected to immunoprecipitation with antibodies against hPcf11 or preimmune serum as a control. Input and precipitated material were analyzed by SDS-PAGE and phosphoimaging. (C) Gel shift experiments with the RNA oligonucleotide 208–221 (Table 2) comparing wild-type CF II, CF II reconstituted with hPcf11ΔN1184, and hPcf11ΔN1184 by itself. Fits indicated K50 values of 3.3 nM for CF II and >100 nM for the two other proteins. (D) Binding of HisSumo-hPcf11zcz (single titration) and GST-hPcf11zcz (n = 2) to RNA oligonucleotide 191–230 (Table 2). Extrapolated K50 values were ∼100 and 200 nM. For comparison, binding of the same RNA to CF II is shown (K50 = 0.5 nM). (E) Sequence logo derived from a selection carried out with hPcf11ΔN1184 and nitrocellulose filter binding. (F) A scheme of the SV40 late 3′ processing signal. CFI and and CstF indicate the respective protein binding sites; PAS is the AAUAAA signal. The yellow box represents the G-rich sequence described in the Introduction. The cleavage site (red triangle) is after nucleotide 176. Numbering of the sequence is as in Table 2. (G) CD spectra of RNA oligonucleotides wt2× and Δ2× show a maximum at 260 nm, indicating a G quadruplex structure, whereas ΔΔ2× has a spectrum similar to that of unstructured U14. The 260 nm peak of Δ2× was sensitive to heating to 90°C.




