


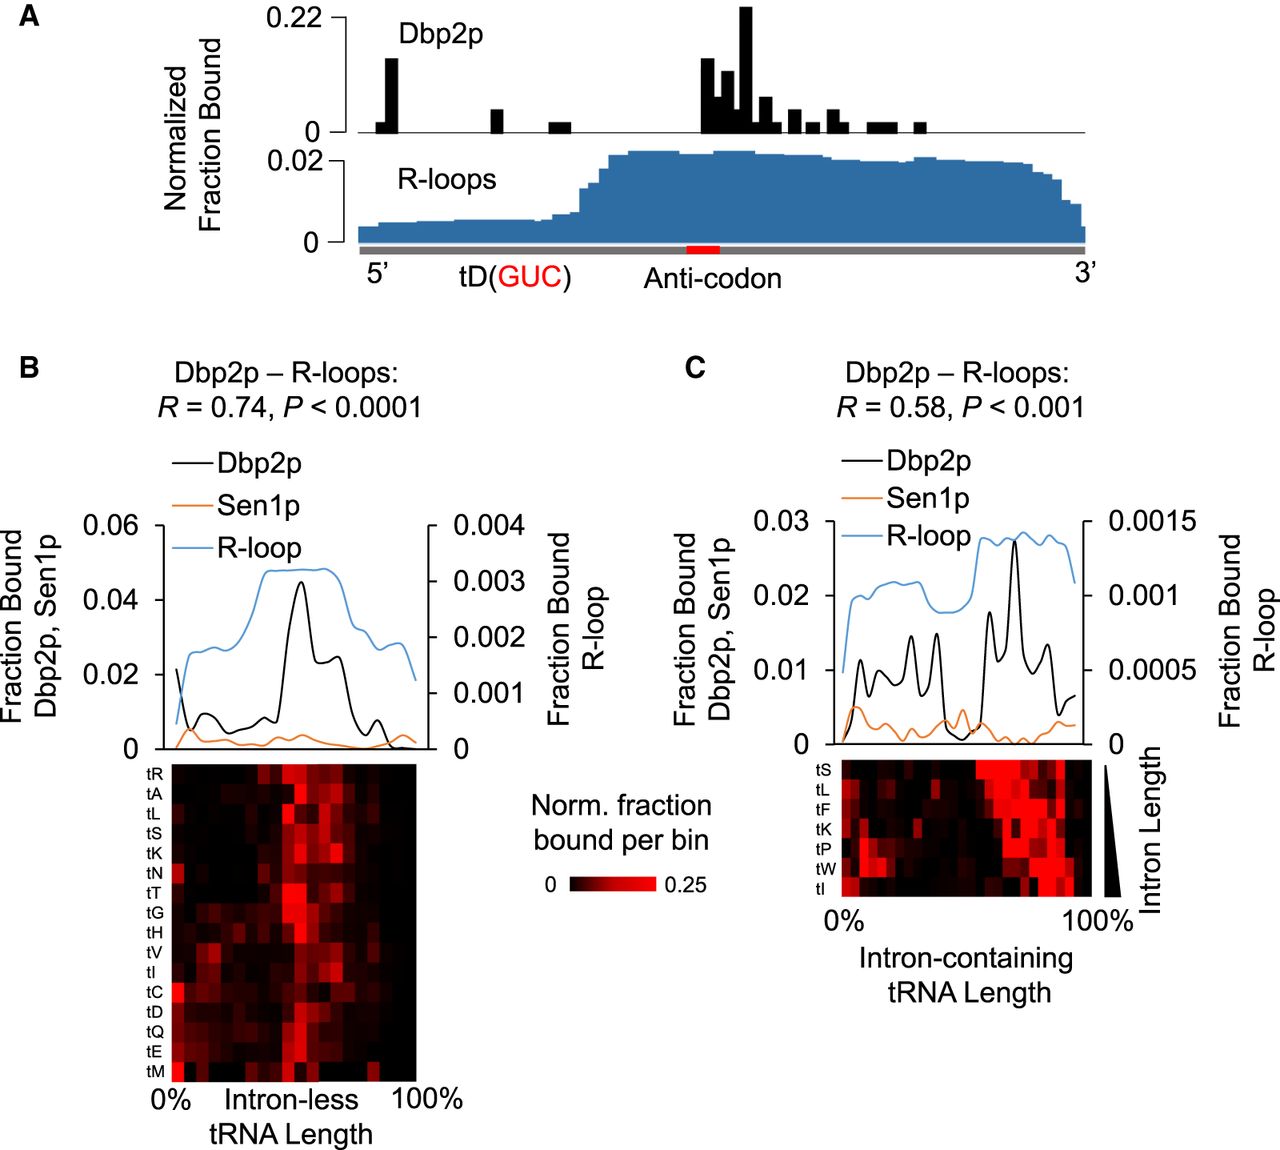
Dbp2p binding and R-loops on tRNAs. (A) Representative traces of Dbp2p iCLIP and R-loops on the tD(GUC) tRNA. The transcript is shown in gray below, and the anti-codon is marked red. (B) Metagene plots for Dbp2p iCLIP, Sen1p PAR-CLIP, and rnh1Δrnh201ΔS1-DRIP-Seq for intronless tRNAs (n = 219), expressed as fractions of binding per bin (Dbp2p and Sen1p) and fraction of read density per bin (R-loops). Dbp2p and R-loop reads were combined for multiple tRNA isoforms for the same amino acid, because the read length did not always allow unambiguous assignment of a specific tRNA isoform. Correlation coefficients (R) and P-values were calculated as in Figure 2C,D. (Lower panel) Fraction of Dbp2p crosslinked (for all tRNA isoforms for each amino acid, averaged from biological replicates). Traces are arranged by hierarchal clustering. The amino acid for the respective tRNA isoforms is indicated on the left. (C) Metagene analysis of Dbp2p iCLIP Sen1p PAR-CLIP, and rnh1Δrnh201ΔS1-DRIP-Seq for intron-containing tRNAs (n = 64). (Upper panel) Metagene plots were generated as in Figure 1F,I, and data are presented as in panel B. Correlation coefficients and P-values were calculated as in Figure 2C,D. (Lower panel) Fraction of Dbp2p crosslinked (for all tRNA isoforms for each amino acid, averaged from biological replicates). Traces are arranged according to intron length. The amino acid for the respective tRNA isoforms is indicated on the left.




