


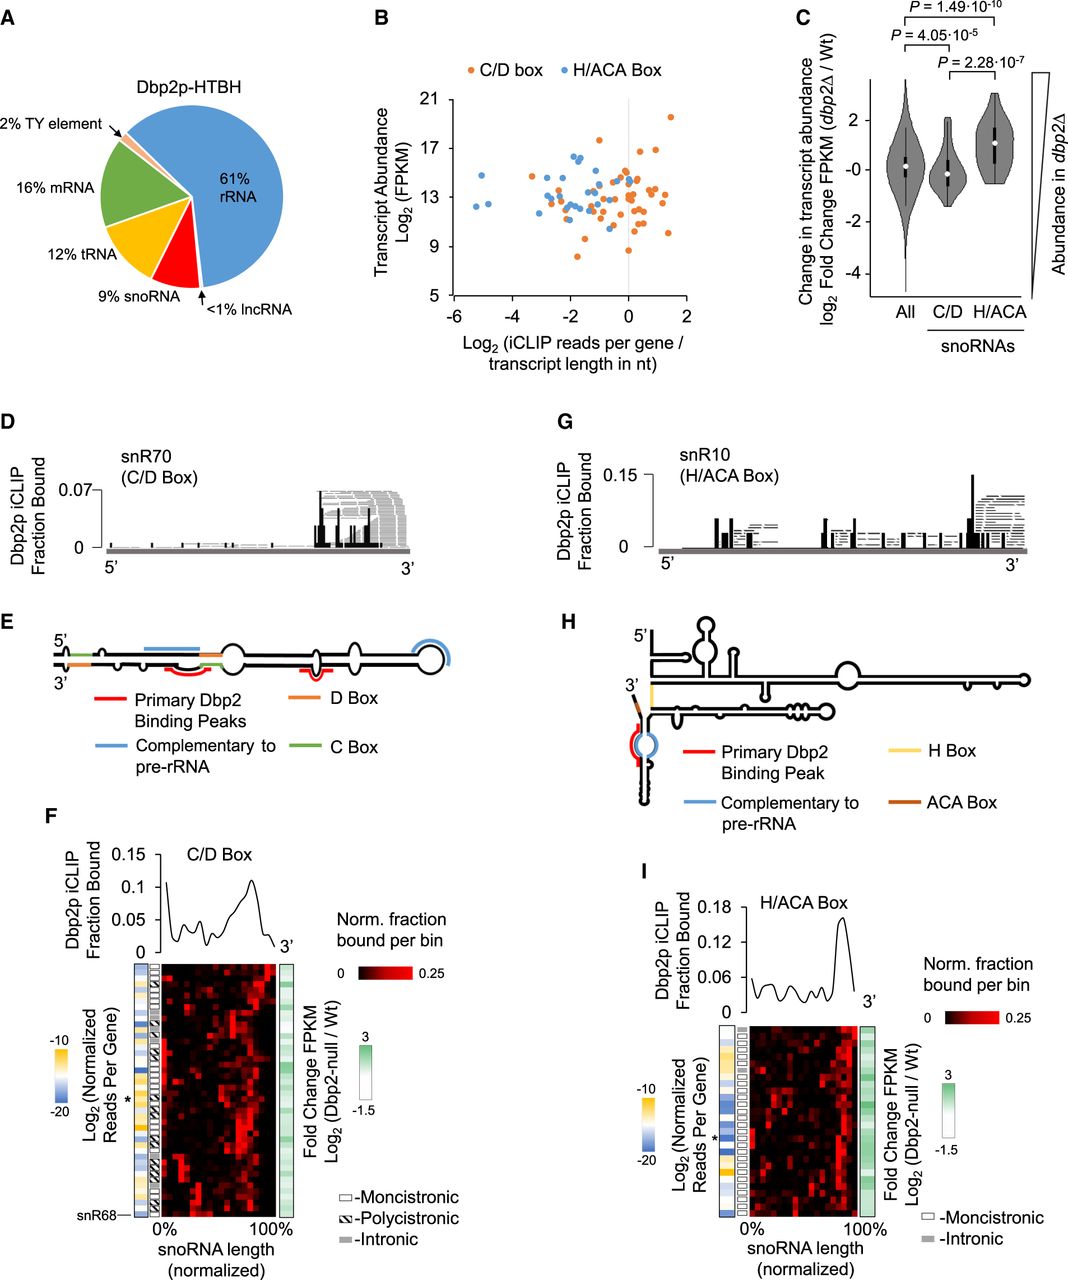
Dbp2p binding to snoRNAs. (A) Distribution of unique, mapped crosslinking reads for Dbp2p. Values represent averages of two data sets from biological replicates. (B) Correlation between expression levels of C/D-box (orange) and H/ACA-box (blue) snoRNAs (determined by RNA-seq) and unique iCLIP reads per snoRNA, normalized for transcript length (nucleotides). Values for expression levels and normalized iCLIP reads represent averages from biological replicates (C/D-box snoRNA: n = 44. H/ACA-box snoRNA: n = 28). (C) Differences between wild-type and dbp2Δ strain expression levels for all RNAs, and C/D-box and H/ACA-box snoRNAs. Values represent averages from biological replicates. P-values were calculated according to Welch's two-tailed t-test (all RNAs: n = 6702. C/D-box snoRNA: n = 44. H/ACA-box snoRNA: n = 28). (D) Representative iCLIP trace for the C/D-box snR70. Black bars indicate 5′ ends of crosslink reads. Dbp2p iCLIP Fraction Bound refers to the black bars (RT stops) and indicates values normalized to the RNA. Gray lines show full sequencing reads. (E) Schematic secondary structure for snR70. Prominent Dbp2p binding sites are marked in red. C-box, D-box, and regions complementary to the ribosome are highlighted as noted in the legend. (F) Metagene analysis of Dbp2p binding to C/D-box snoRNAs (n = 44). (Upper panel) Plot of fractions of iCLIP reads per RNA bin (averaged from biological replicates), normalized for each C/D-box snoRNA (e.g., panel E) and averaged for all C/D-box snoRNAs. (Lower panel) Fraction of Dbp2p crosslinked (per bin) for all C/D-box snoRNAs, averaged from both biological replicates. Traces are arranged by hierarchal clustering. Blue and gold colored blocks on the left show the degree of Dbp2p crosslinked to a given transcript (log2 iCLIP reads per transcript, normalized to transcript length in nucleotides, divided by transcript abundance in FPKM). The grayscale blocks indicate whether the snoRNA is monocistronically, polycistronically, or intronically encoded. White and green colored blocks on the right show the changes in expression level for the respective snoRNA between wild-type and dbp2Δ strain (log2 fold change in FPKM). The asterisk marks snR70. (G) Representative iCLIP trace for the H/ACA-box snR10. Black bars indicate 5′ ends of crosslink reads. Fraction Bound refers to the black bars (RT stops) and indicates values normalized to the RNA. Gray lines show full sequencing reads. (H) Schematic secondary structure for snR30. Prominent Dbp2p binding sites are marked in red. H-box, ACA box, and regions complementary to the ribosome are highlighted as noted in the legend. (I) Metagene analysis of Dbp2p binding to H/ACA-box snoRNAs (n = 28). Data are presented as described for C/D-box snoRNAs in panel G. The asterisk marks snR10.




