


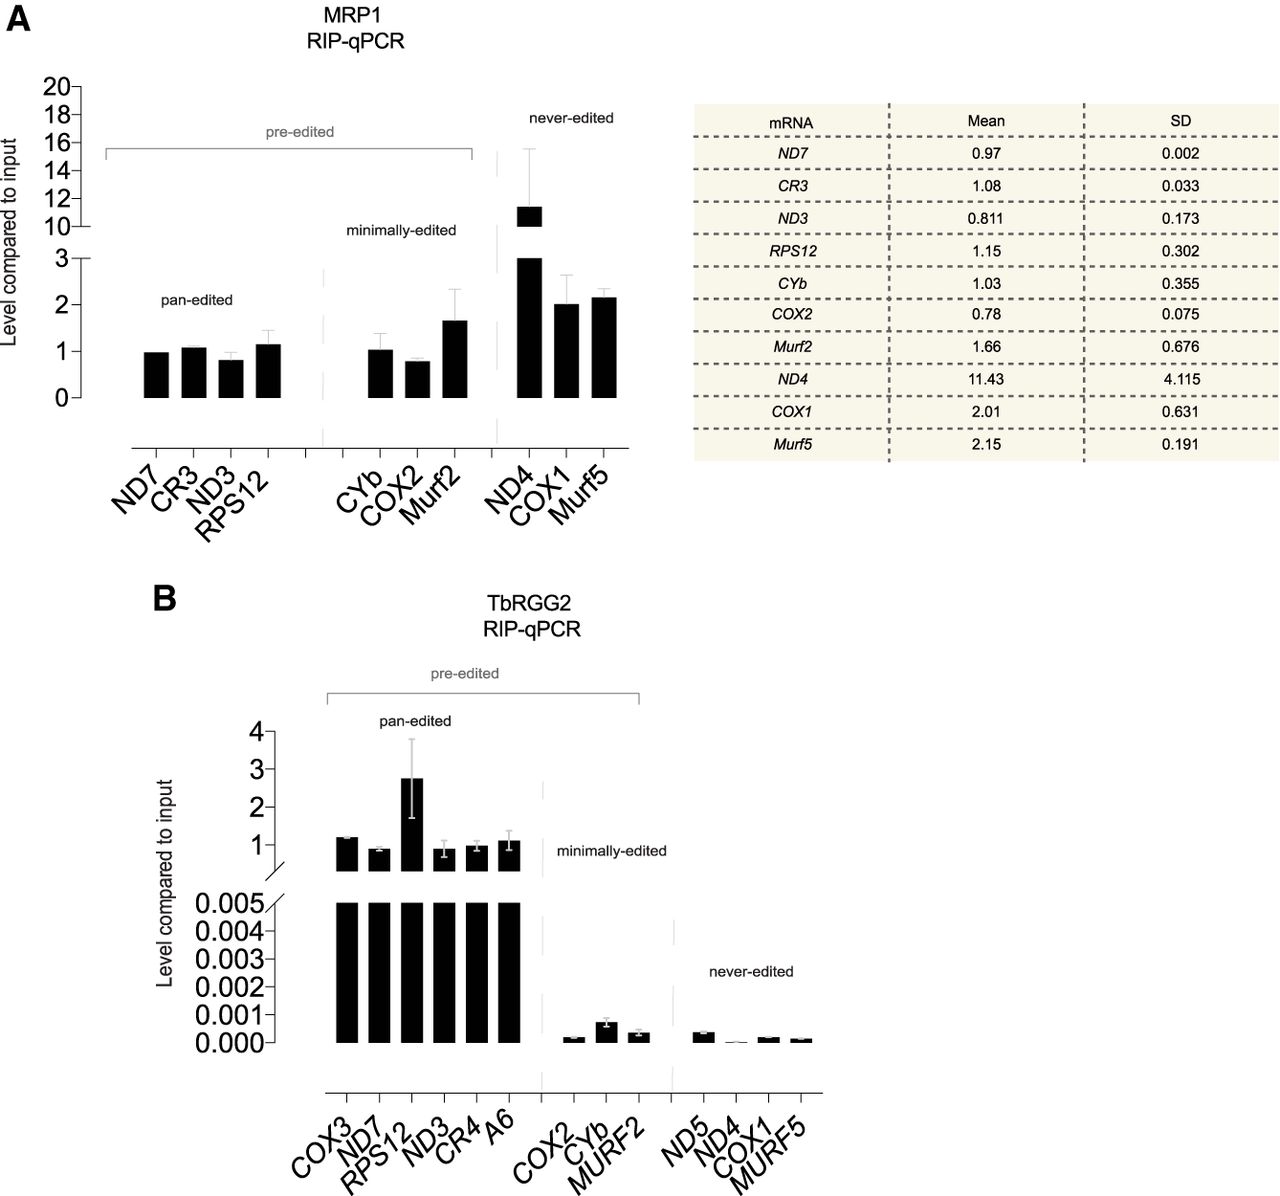
FIGURE 5.
RIP-qPCR for MRP1 and TbRGG2. (A) MRP1 RIP-qPCR. Bar plots show the relative amount of representative pre- and never-edited mRNAs coimmunoprecipitated with MRP1. Abundance of each mRNA is presented relative to the abundance of the same mRNA recovered from 1% of input lysate. Two biological replicates (collected on different days) were performed in triplicate. Error bars show standard deviation. Table shows the averages and standard deviation of the tested mRNAs. (B) TbRGG2 RIP-qPCR. As in A.




