


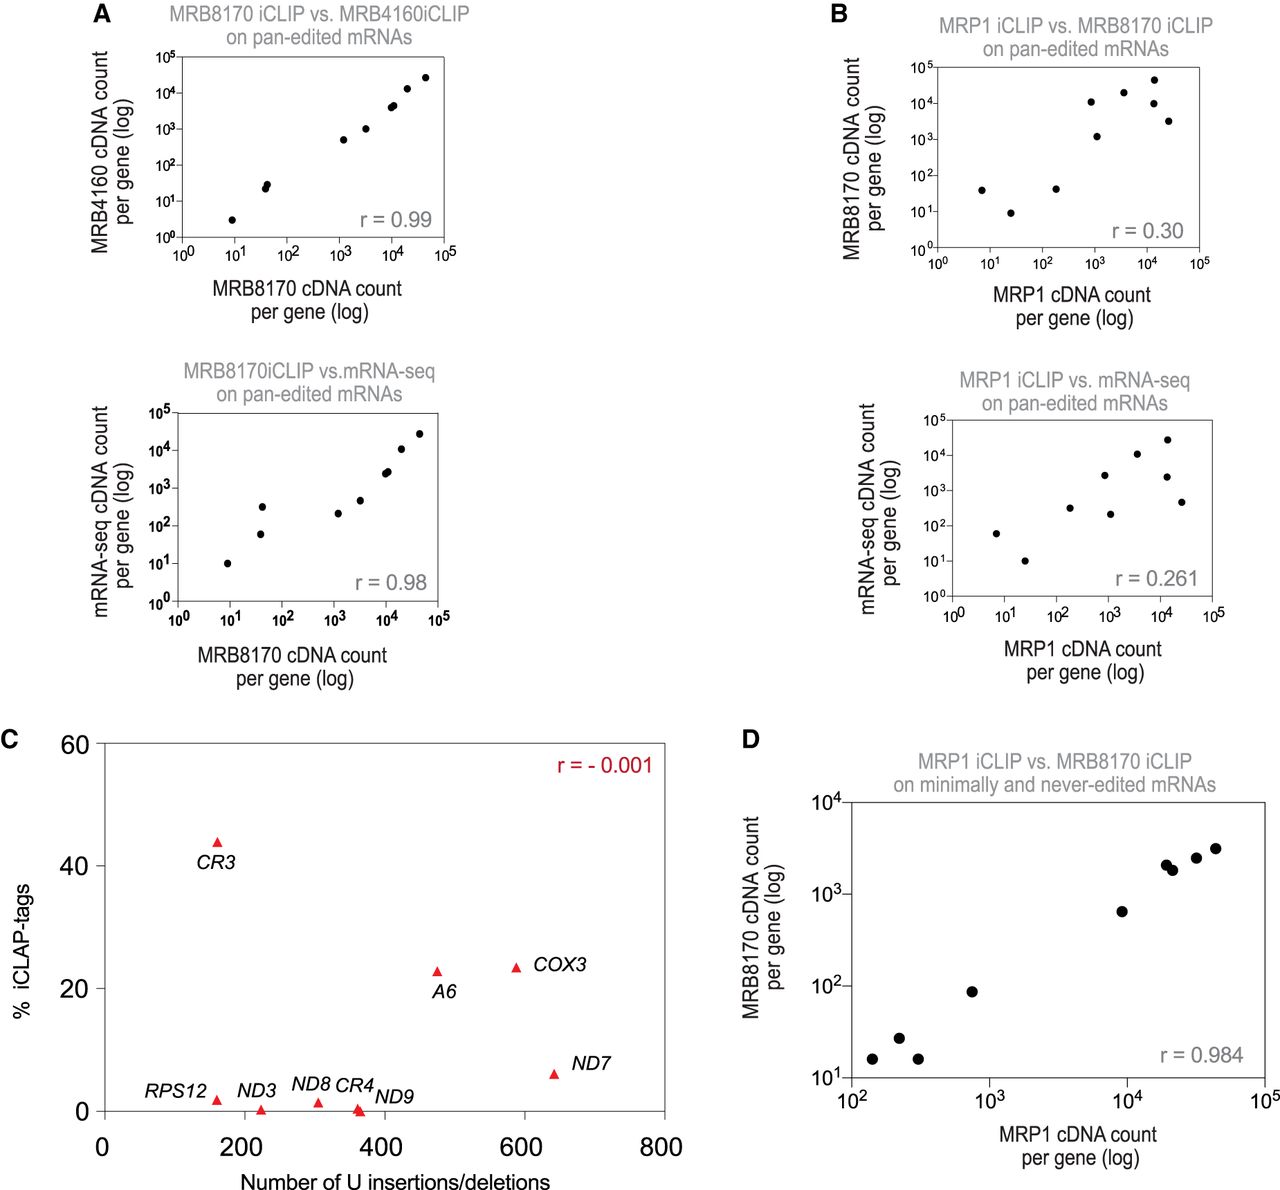
Comparison of MRP1 and MRB8170 association with mRNAs. (A) Plots comparing the total number of iCLIP tags of each of nine pan-edited mRNAs from MRB8170 IPs to those of MRB4160 IPs, and MRB8170 iCLIP tags to total mRNA-seq data. Pearson correlation coefficients are (r) indicated. (B) As in B, from MRP1 iCLIP, MRB8170 iCLIP, and total mRNA-seq data. (C) Correlation between total MRP1 iCLIP tags (y-axis) of each pan-edited transcript and its respective number of U insertions and deletions required to generate the fully edited, translatable sequence (x-axis). Pearson correlation coefficients (r) are indicated. (D) Plots comparing the total number of iCLIP tags of the combined minimally and never-edited mRNAs from MRB8170 and MRP1 iCLIP data. The Pearson correlation coefficient (r) is indicated. See also Supplemental Figure S6.




