


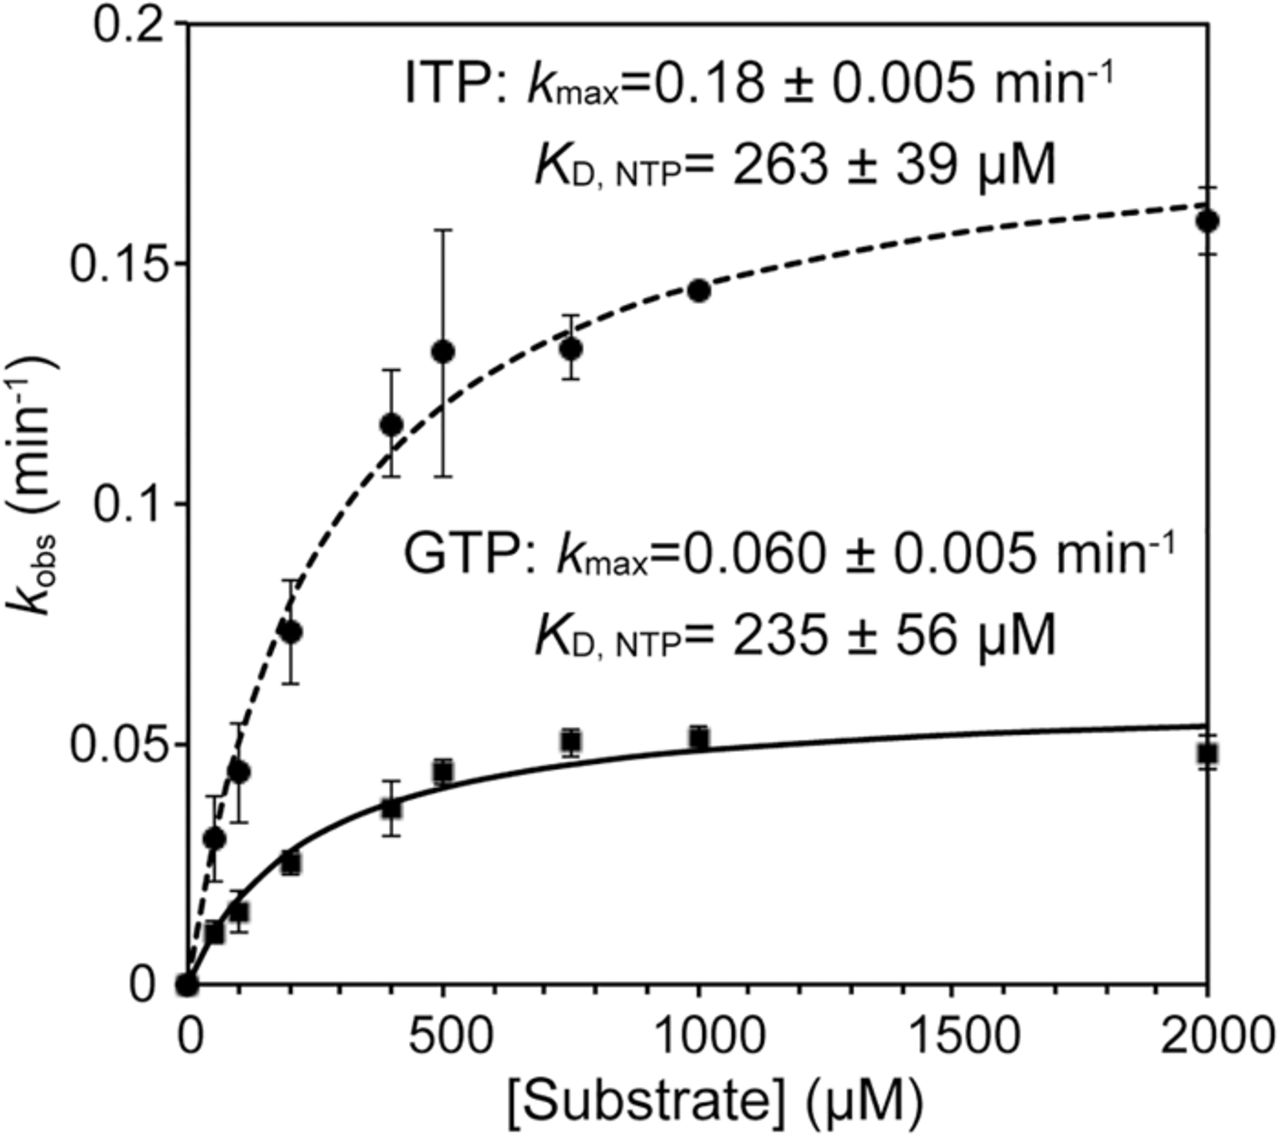
FIGURE 5.
Comparison of the maximum rate constants (kmax) and apparent dissociation constants (KDapp) of GTP and ITP in the nucleotide addition reaction. Observed rates of nucleotide addition reaction determined in the presence of 10 µM Thg1 and various concentrations of GTP or ITP (50–2000 µM) were plotted as a function of (substrate NTP) and fit to Equation 2 to determine the kmax and KDapp for ITP or GTP. The bars in the graphs are SD of more than two independent experiments.




