


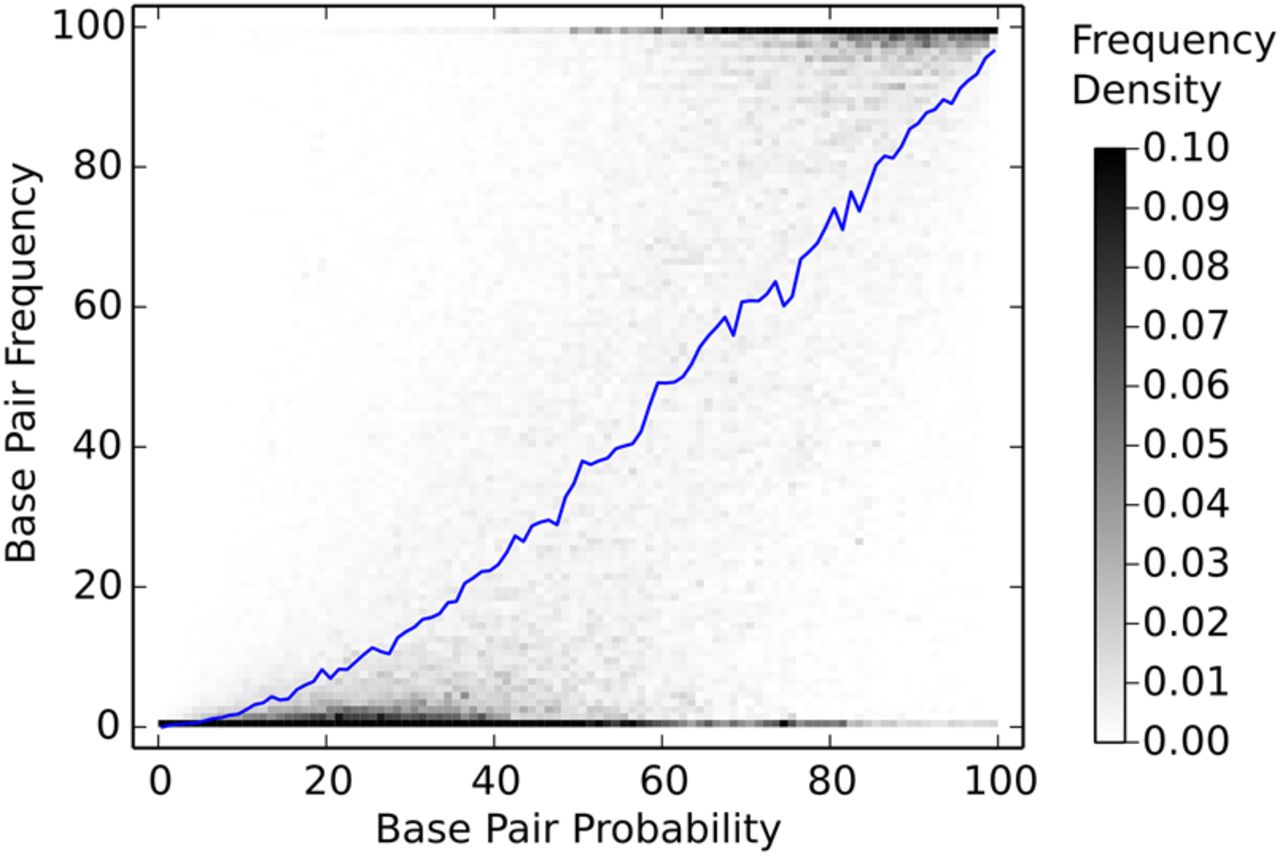
Base pair frequency is correlated with predicted base pair probability. The secondary structure for each sequence in the archive was determined using 1000 parameter sets that were generated by randomly perturbing experimental values within experimental uncertainty. The frequency of prediction was calculated for each possible base pair and plotted against the base pair probability predicted using an unperturbed (reference) parameter set. The shades of gray indicate the proportion of the base pairs in the pair probability bin that are observed with that frequency. The blue line plots the average pair frequency for that pair probability bin. Bins have a width of 1% in the probability and frequency dimensions. Note that scale has been clipped to highlight detail.




