


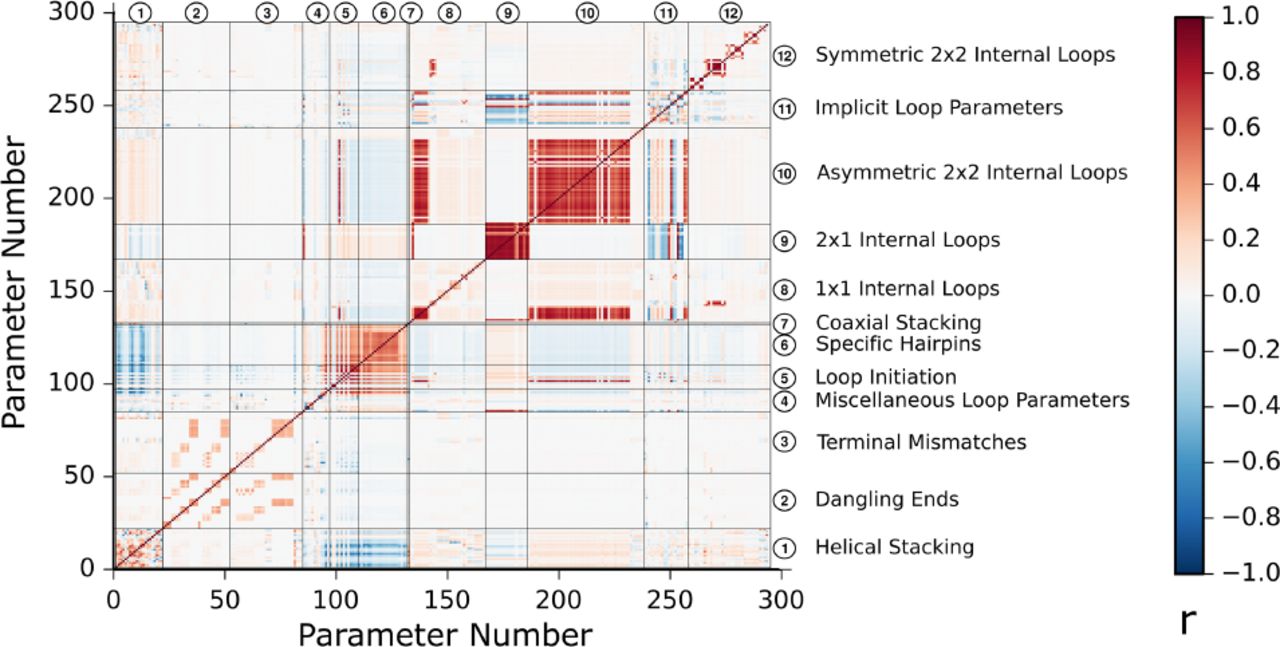
Observed Pearson correlation coefficients (r) across perturbed sets of nearest neighbor parameter values. A total of 100,000 parameter sets were randomly generated by simultaneously perturbing all experiment values within their uncertainty and then using those experiment values to derive new parameter sets. On the x- and y-axes are the independent parameter indices for the 294 independent parameters in the nearest neighbor rules (Zuber et al. 2017). The positive correlations between parameters are shown in red and negative correlations between parameters are shown in blue. An interactive version of this figure is available at http://rna.urmc.rochester.edu/publications.html.




