


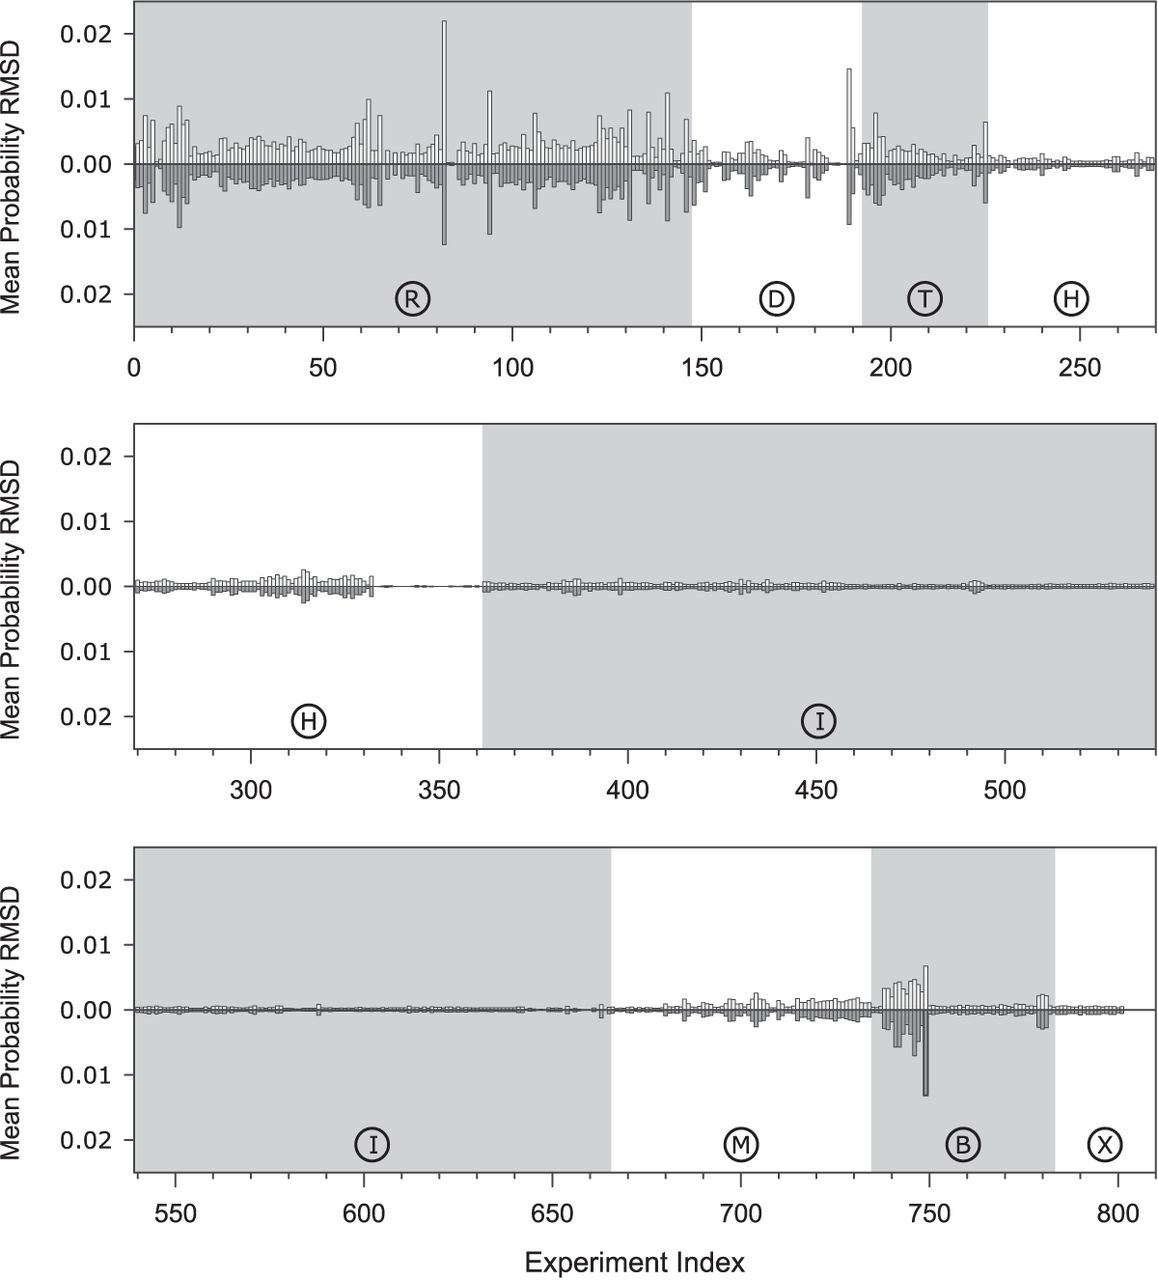
Sensitivity analysis by perturbing single optical melting experiments. Experiment indices are along the x-axis, organized by the type of RNA motif, denoted by the letters in the circles that correspond to the experiment codes in Supplemental Tables 1–8. Mean base pair probability RMSD for the entire sequence archive (except randomized sequences) is shown for the perturbation of ±3 σ. Randomly shuffled sequences were excluded so that the sensitivity scores would more accurately reflect the uncertainty in the structure predictions of natural ncRNAs. The RMSDs for +3 σ are shown above the x-axis, while the RMSDs for −3 σ are shown below the x-axis. The details of each experiment are available in Supplemental Tables 1–8.




