


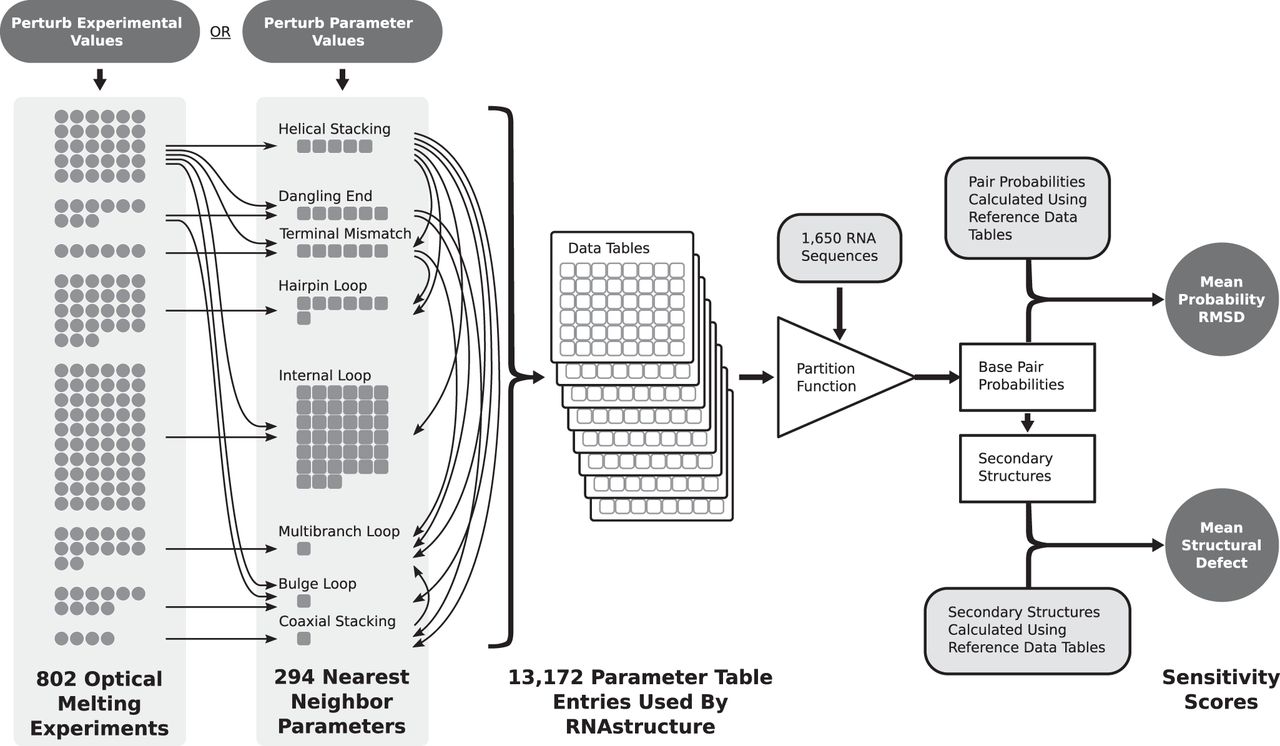
Experimental outline. The nearest neighbor parameters are derived from 802 optical melting experiments on small model systems, as illustrated in the first column, where each circle represents approximately five experiments. A total of 294 independent nearest neighbor parameters are fit, as illustrated in the second column, where each square stands for approximately five nearest neighbor parameters. The arrows show how nearest neighbor parameters depend on the experiments and also on each other. The third column illustrates the total number of parameter table entries that are used by the RNAstructure software package. In this work, perturbed thermodynamic data tables are generated by either perturbing the experimental values used to generate the nearest neighbor parameters based on the experimental uncertainty, or by directly perturbing the nearest neighbor parameters based on the standard error of the regression (for parameters determined by linear regression) or uncertainty values calculated by the propagation of error from the underlying experiments (Zuber et al. 2017). Parameter tables using these perturbed nearest neighbor parameter sets are then used to predict base-pairing probabilities and secondary structures for an archive of 1650 sequences. The pair probabilities and structures are then compared to those obtained using the reference parameter set.




