


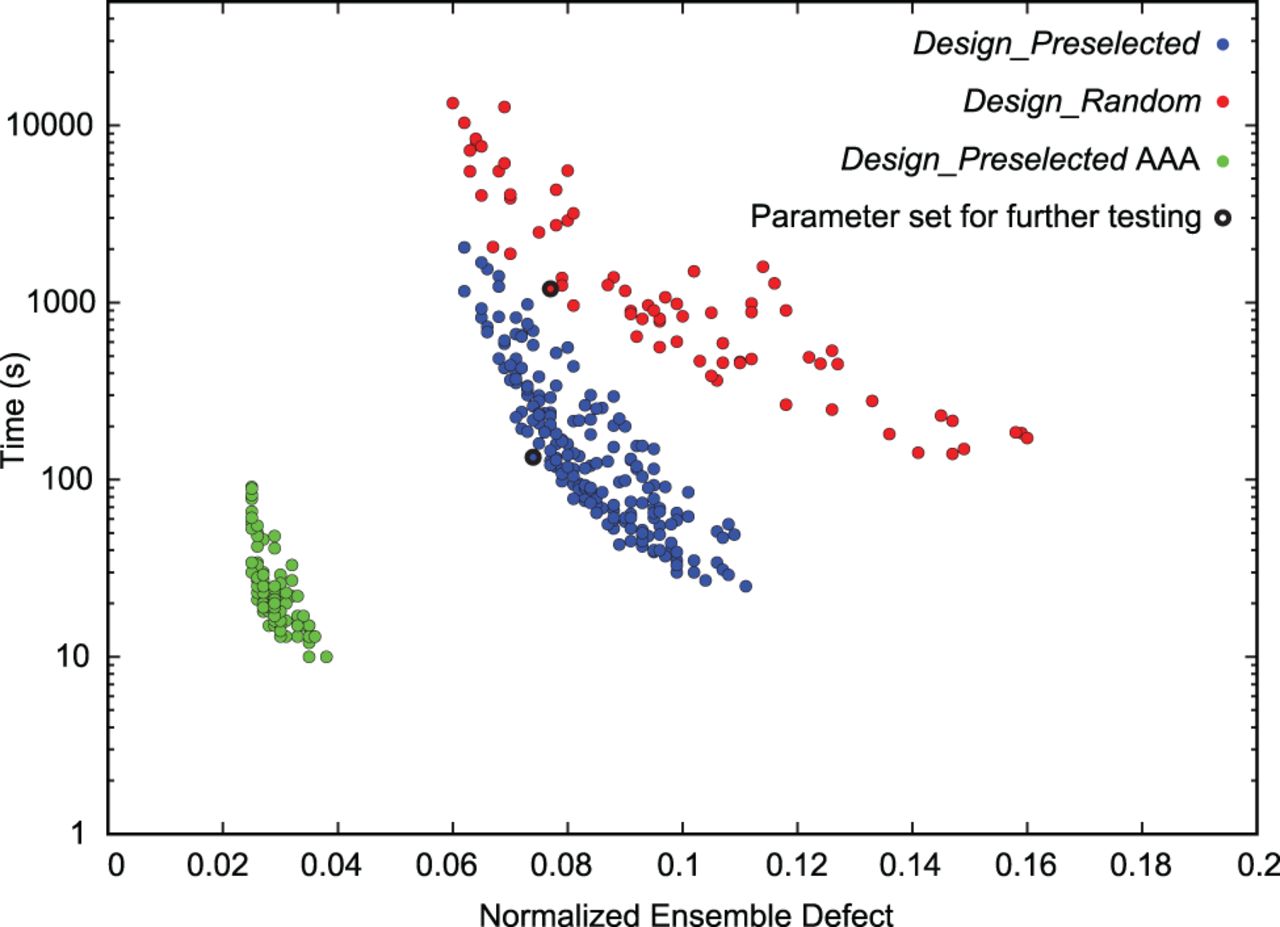
FIGURE 2.
Algorithm performance distribution for sets of parameters. Blue and red dots represent performance of Design algorithm in Preselected and Random modes, respectively. Green shows the performance of the Design algorithm in Preselected mode using all adenines in place of single stranded regions. Each dot is the mean performance for a single set of parameters. Black outlines show the parameter sets that are used for further performance evaluation on a different set of structures. Performance is evaluated as mean time as function of mean NED.




