


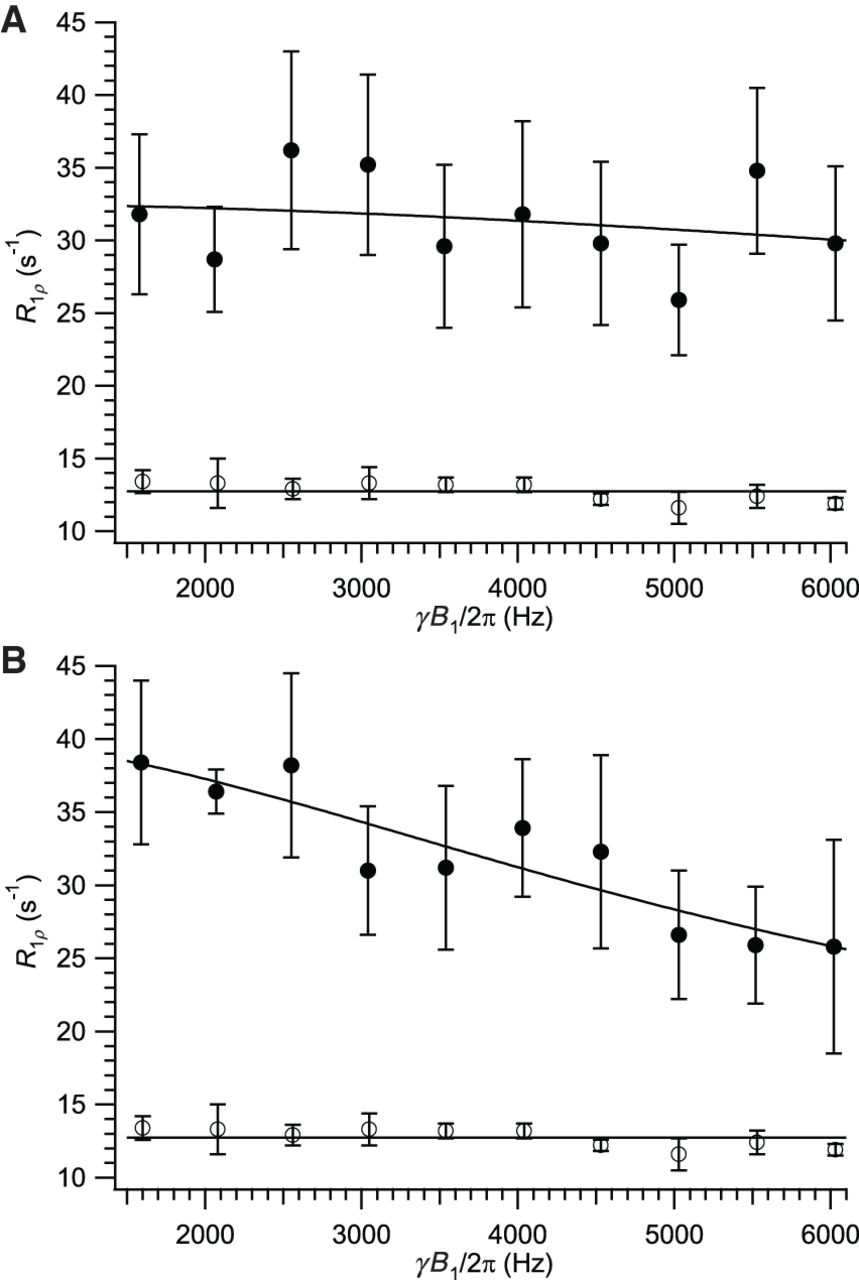
FIGURE 6.
Relaxation-dispersion curves. (A) Cyt-6 C2′ (solid); (B) Cyt-6 C4′ (solid). Open symbols in both panels are the helical residue Cyt-28 C2′ for comparison. Fits to the upper curves are to Equations 2 and 3 with R1ρ fixed to 12.7 sec−1 based on the mean value for helical Cyt-6 C2′. Fits in which  was allowed to vary resulted in extremely poor parameter determination. Fit parameters: Cyt-6 C2′, kex = (1.0 ± 0.8) × 105 sec−1, Φex = (2.0 ± 1.3) × 106, Δωmin = (3.0 ± 1.0) ppm; Cyt-6 C4′, kex = (3.6 ± 0.5) × 104 sec−1, Φex = (9.9 ± 0.7) × 105, Δωmin = (2.1 ± 0.1) ppm.




