


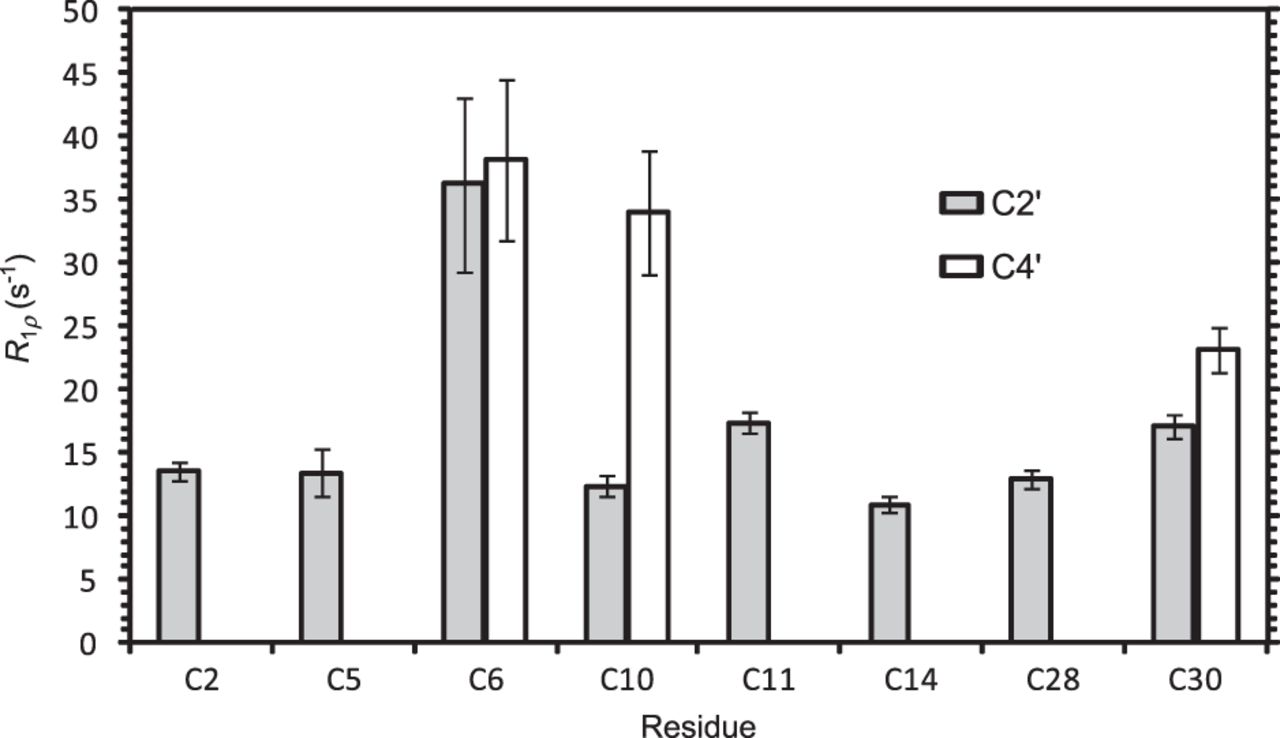
FIGURE 5.
Transverse relaxation rates for the 2′,4′-13C2-cytidine-leadzyme. Values correspond to R1ρ data at γB1/2π = 3.0 KHz. Error bars are as reported by the fit software for a single-exponential decay.
(Downloading may take up to 30 seconds. If the slide opens in your browser, select File -> Save As to save it.)
Click on image to view larger version.
Transverse relaxation rates for the 2′,4′-13C2-cytidine-leadzyme. Values correspond to R1ρ data at γB1/2π = 3.0 KHz. Error bars are as reported by the fit software for a single-exponential decay.
 CiteULike
 Delicious
 Digg
Digg Facebook
 Reddit
 Twitter
Molecular Cloning
The New Edition
Buy Now and Save 30%
Paperback only
(limited time offer)

|
Molecular Cloning: A Laboratory Manual (Fourth Edition) |
