


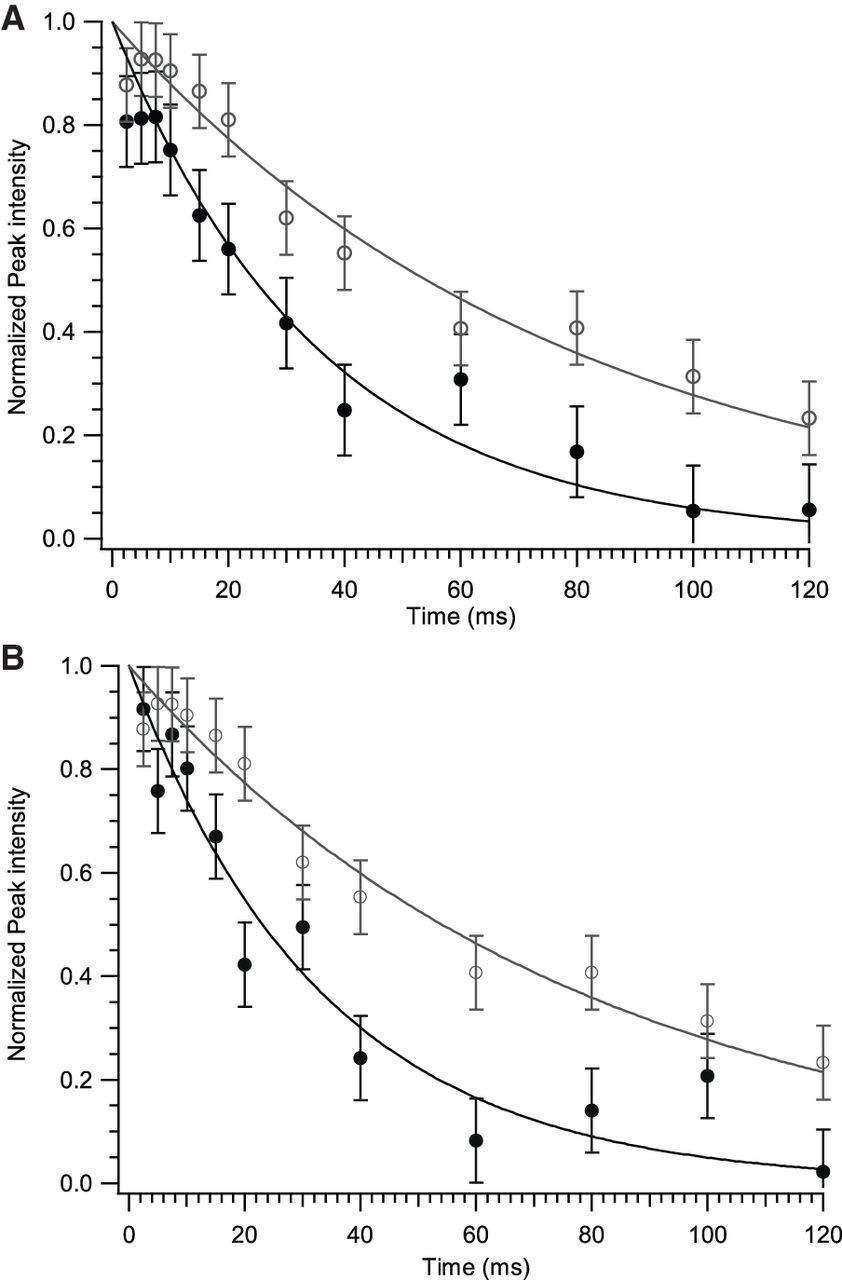
FIGURE 4.
Illustrative R1ρ transverse relaxation curves at γB1/2π = 3.0 KHz for internal-loop peaks. (A) Cyt-6 C2′ (solid); (B) Cyt-6 C4′ (solid). Open symbols in both panels are the helical residue Cyt-28 C2′ for comparison. Curves were normalized such that extrapolated intensity at t = 0 was unity. Error bars were derived from threefold replicas of a single time point.




