


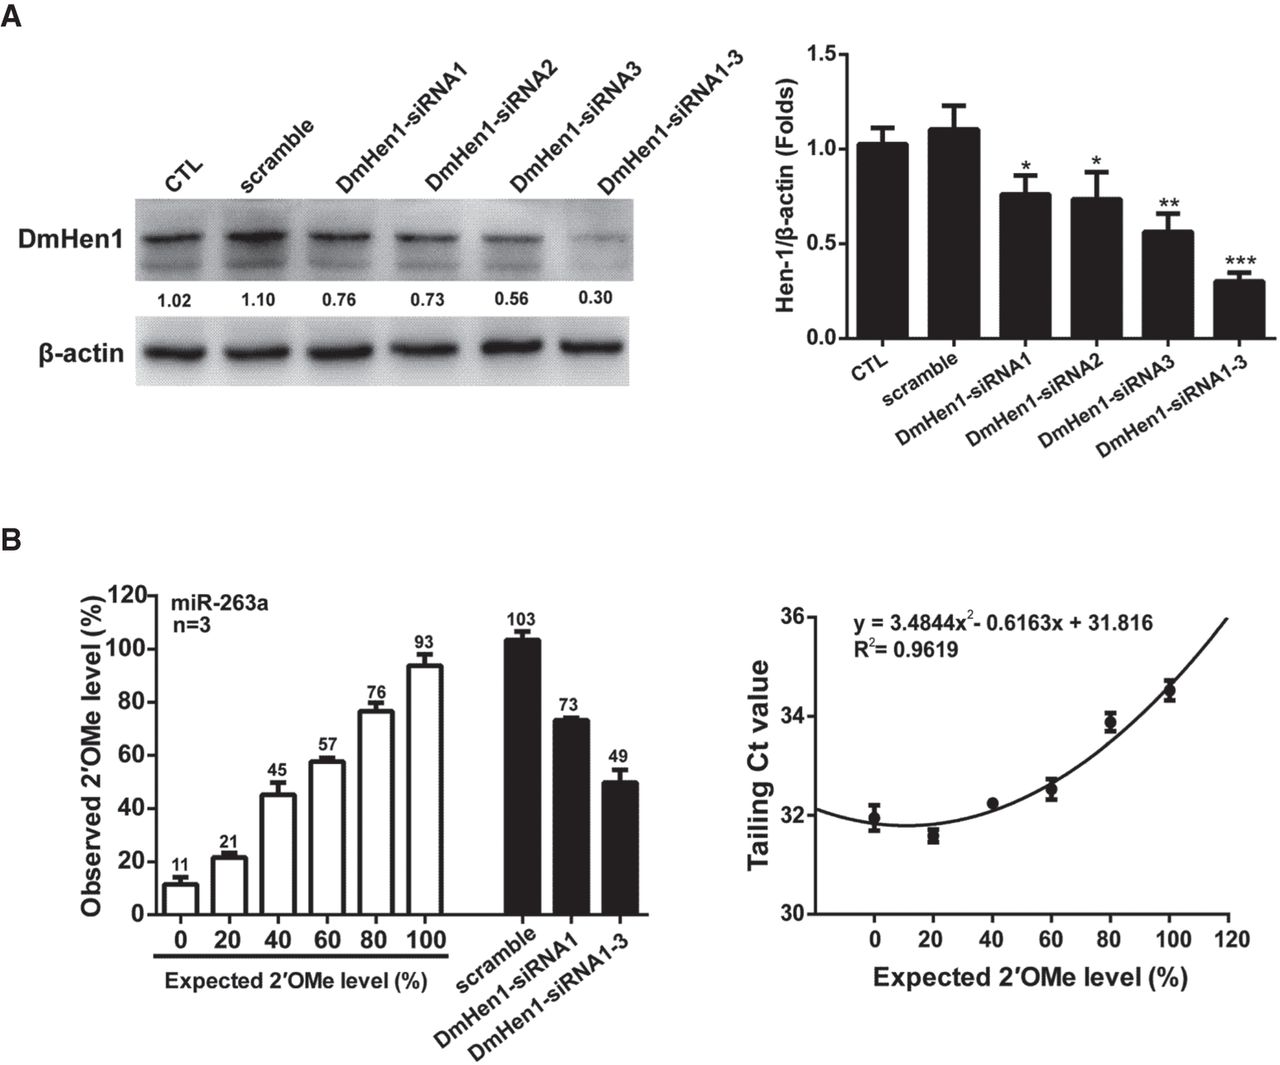
FIGURE 5.
The 2′Ome level of Drosophila Dme-miR-263-5p in Drosophila Schneider 2 cells with or without silencing DmHen1. (A) Reduction of DmHen1 in Drosophila Schneider 2 cells via DmHen1 siRNAs analyzed by western blotting. (B) The 2′Ome level of Dme-miR-263-5p in Drosophila Schneider 2 cells treated with DmHen1 siRNAs was decreased compared to that in Drosophila Schneider 2 cells treated with scramble oligonucleotides. The detected methylation ratios of Drosophila Dme-miR-263-5p and synthetic methylated or unmethylated Dme-miR-263-5p are indicated on the top of the column, while the standard curves of Ct versus methylation for Dme-miR-263-5p are shown in the upper right. Data are presented as Mean ± SE (n = 3).




