


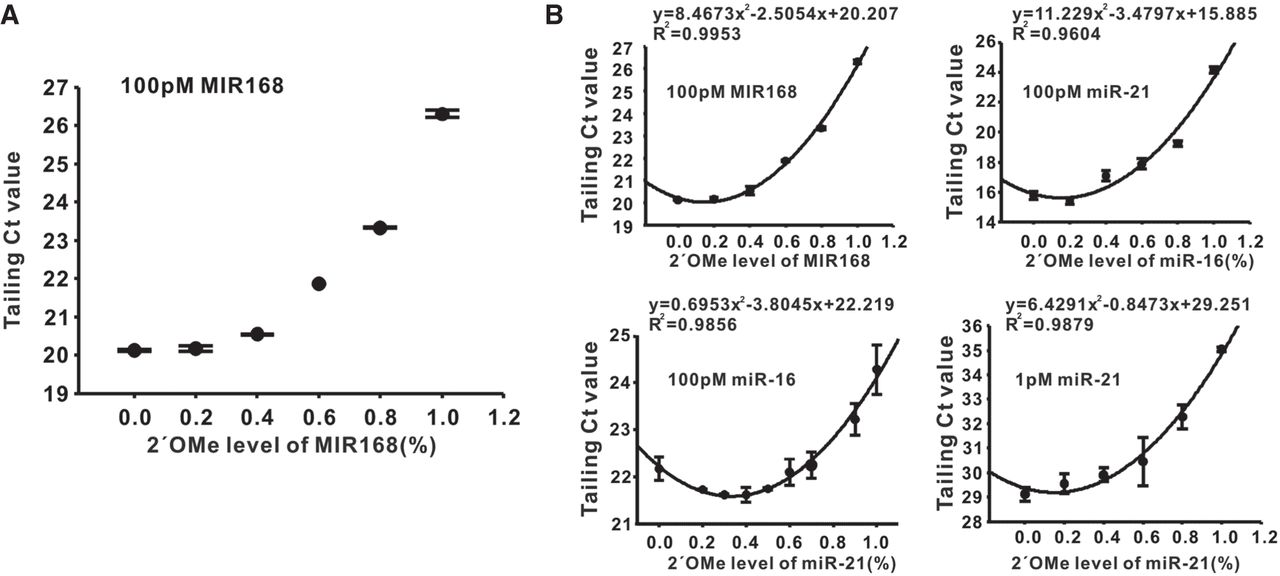
FIGURE 3.
Ct value of poly(A)-tailed RT-qPCR and methylation ratio fit of a quadratic curve. (A) Scatter plot of tailing Ct and methylation fraction for synthetic MIR168. The distribution of plots presents a curve. (B) Regression curve of Ct value and methylation ratio for different miRNAs at different concentrations. Upper left is 100 pM MIR168, upper right is 100 pM miR-16, lower left is 100 pM miR-21, and lower right is 1 pM miR-21. Data are presented as Mean ± SE (n = 9).




