


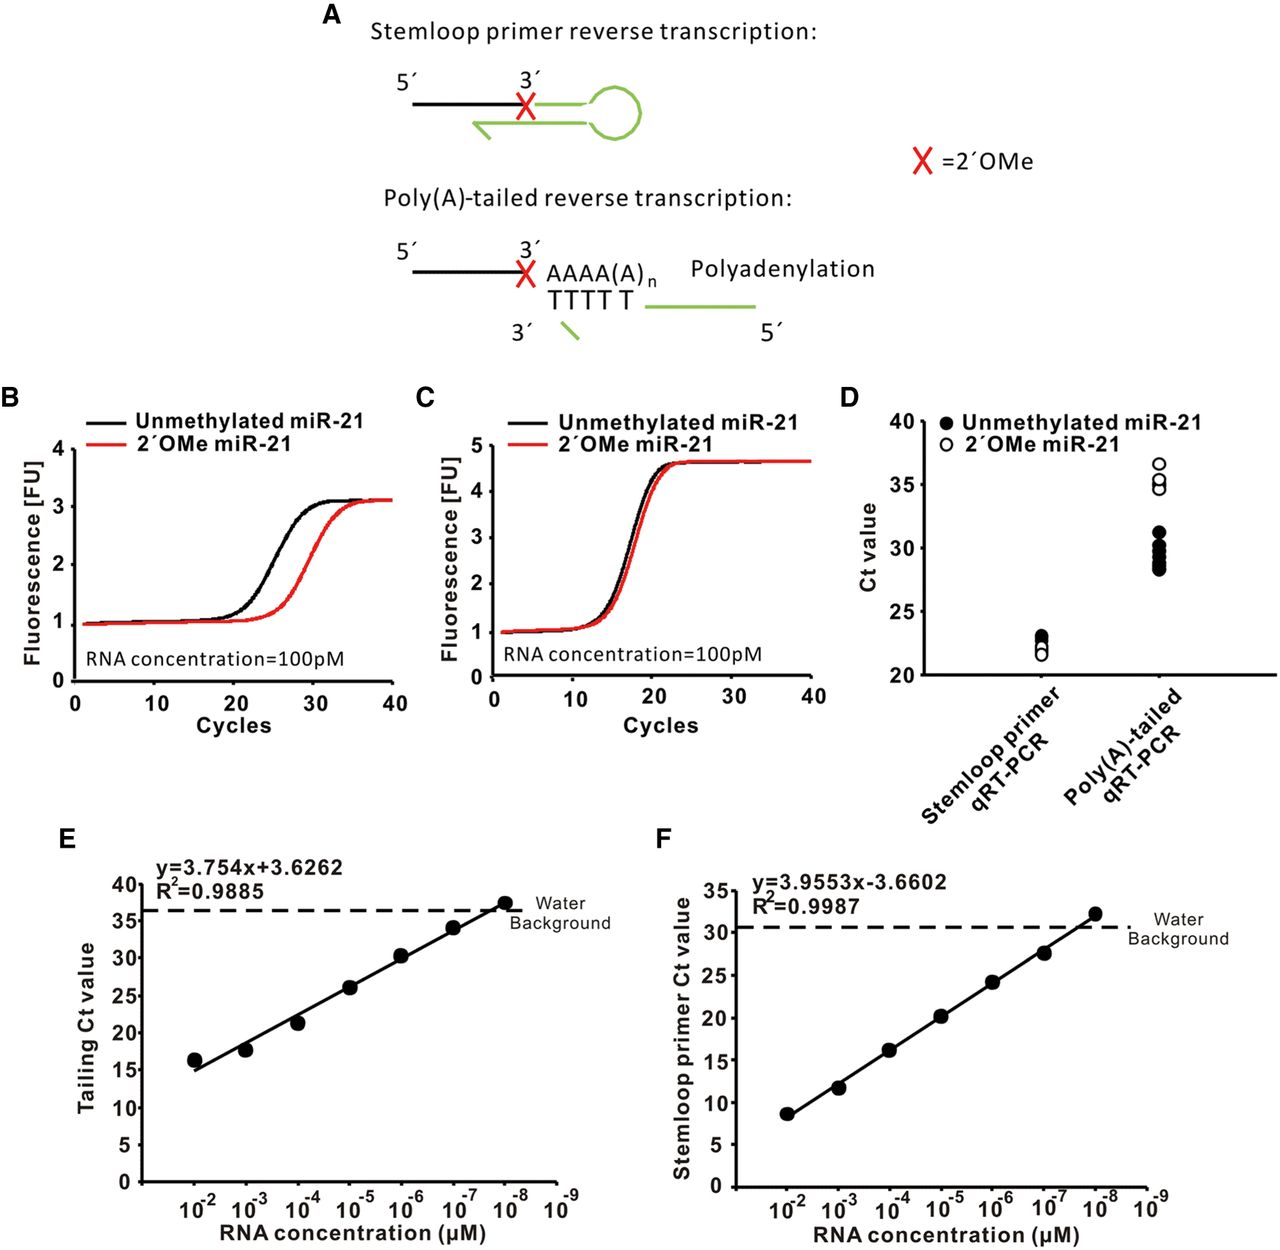
Amplification delay on 2′OMe miR-21 by poly(A)-tailed RT-qPCR. (A) Schematic diagram of stem–loop primer reverse transcription and poly(A)-tailed reverse transcription. Black line represents template miRNA. Green line represents the stem–loop primers or universal primers. Red cross represents methylation site. (B) The amplification curve of poly(A)-tailed RT-qPCR for unmethylated miR-21 and 2′Ome miR-21. Note that there is a significant amplification delay by poly(A)-tailed RT-qPCR between unmethylated miR-21 and 2′Ome miR-21. (C) The amplification curve of stem–loop primer RT-qPCR for unmethylated miR-21 and 2′Ome miR-21. Note that there is no significant amplification delay by stem–loop primer RT-qPCR between unmethylated miR-21 and 2′Ome miR-21. (D) Ct value of stem–loop primer RT-qPCR and poly(A)-tailed RT-qPCR for unmethylated miR-21 and 2′Ome miR-21. Data were presented as scatter plots (n = 9). (E) The standard curve of stem–loop primer RT-qPCR for miR-21. RNA concentration represents the synthetic miR-21 concentration before reverse transcription. (F) The standard curve of poly(A)-tailed RT-qPCR for miR-21. RNA concentration represented the synthetic miR-21 concentration before reverse transcription. In panels E and F, the concentration ranges from 10−3 to 10−9 µM. The upper left shows the regression equation and the goodness-of-fit.




