


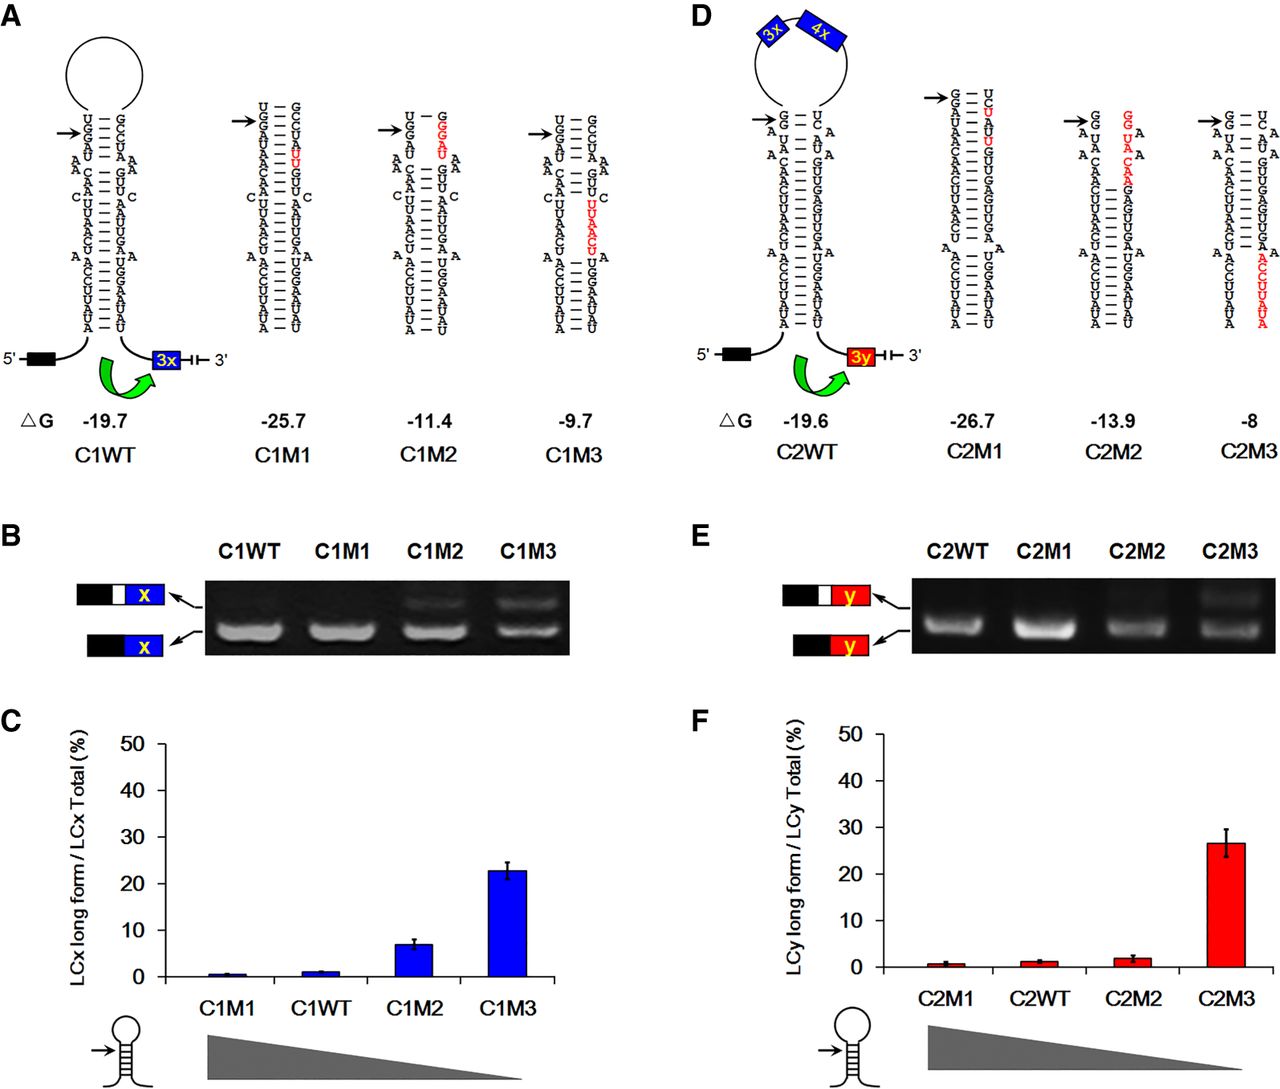
Long PGRP-LCx and LCy isoforms are inhibited by RNA pairing. (A) An overview of various mutants used to assess the effects of RNA pairing on inhibiting the long PGRP-LCx isoform. Predicted RNA pairing for the WT and a series of mutants (C1M1–C1M3, point mutations are shown in red) with the estimated equilibrium free energies (given in kcal/mol). Black arrow depicts an intron–exon boundary. Symbols used are the same as those in Figure 1. (B) The strength of RNA pairing modulated the LCx splice pattern according to mutation analysis. (C) Quantitation of the data in B. Data are expressed as the percentage mean ± SD from three independent experiments. LCx inclusion was negatively correlated with the strength of RNA pairing. (D) An overview of various mutants used to assess the effects on inhibiting long PGRP-LCy. Predicted RNA pairing for the WT and a series of mutants (C2M1–C2M3) is shown. (E) The strength of RNA pairing modulated the LCy splice pattern according to mutation analysis. (F) Quantitation of the data in E. Inclusion of long LCy was negatively correlated with the strength of RNA pairing.




