


FIGURE 5.
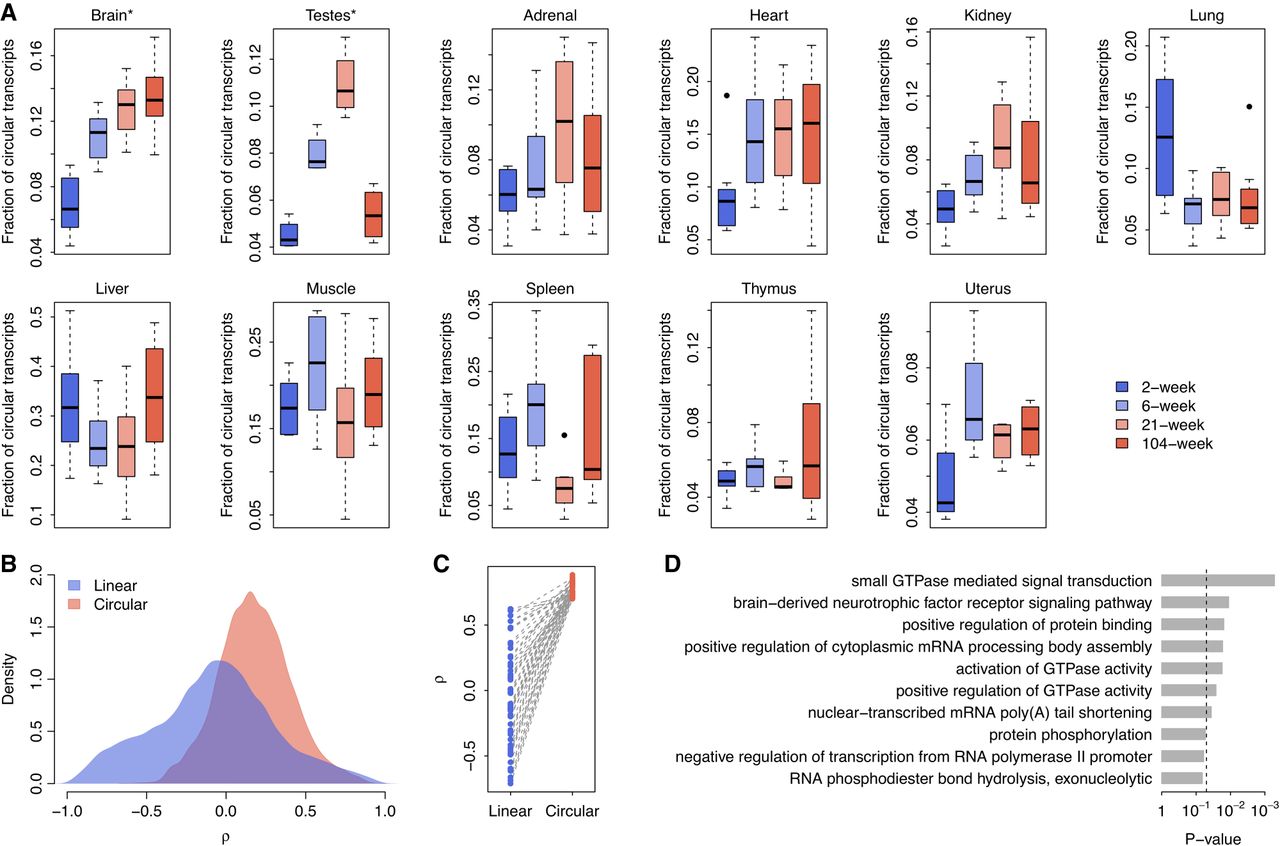
Age-dependent circRNA expression. (A) Relationship between age and overall circRNA abundance across the 11 tissue types. (B) Distribution of the correlation coefficients (ρ) between age and the expression of linear/circular transcripts in the brain. The ρ values were calculated with Spearman's rank correlation test. (C) Paired comparisons of ρ between the circRNAs that accumulated with age (ρ > 0.7) and their linear counterparts in the brain. (D) Top 10 GOBP terms associated with the circRNAs that accumulated with age in the brain. The P-values were calculated with Fisher's exact test. The vertical dashed line indicates the significance level of α = 0.05.




