


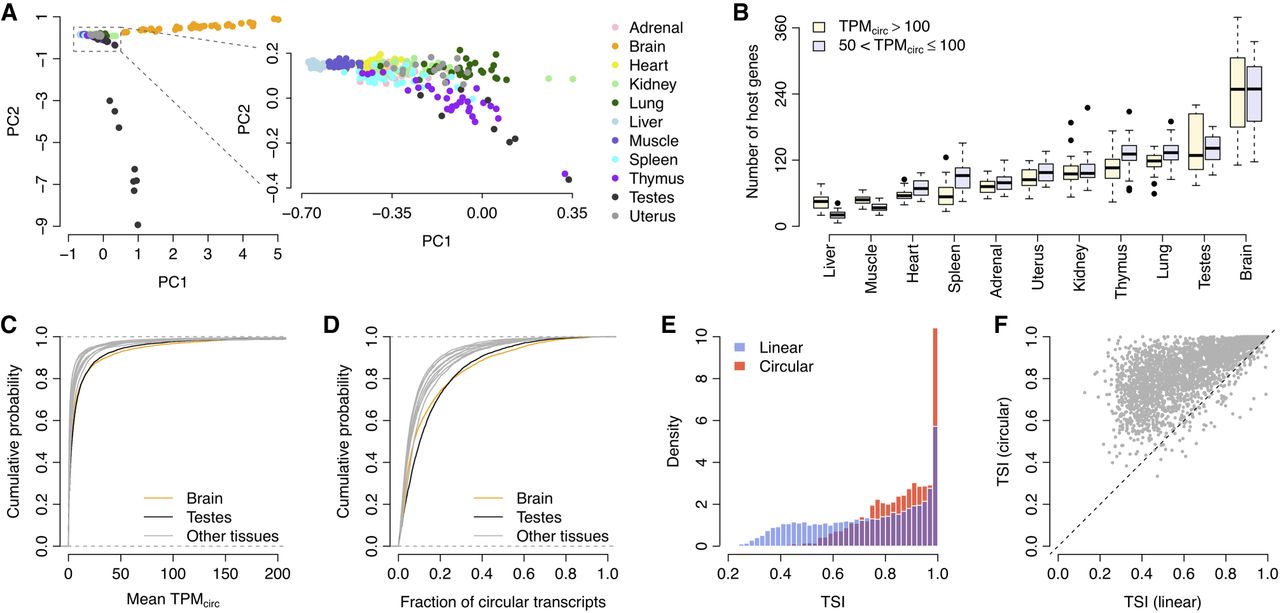
Tissue specificity of circRNA expression. (A) PCA of circRNA expression. Each dot represents one tissue sample. (PC1) First principal component, (PC2) second principal component. (B) Number of host genes with high circRNA expression. Genes with relatively higher TPMcirc were categorized into two groups: TPMcirc > 100 and 50 < TPMcirc < 100. Each boxplot consists of 32 samples from the specific tissue type, except for the testes and uterus, for which only 16 samples are included. (C) Cumulative distribution of the mean TPMcirc values across all 11 tissue types. (D) Cumulative distribution of the fraction of circular transcripts across all 11 tissue types. (E) Histogram of the TSI of both linear and circular transcripts. (F) Paired comparison of TSI between linear and circular transcripts. Each dot represents one host gene. The dots above the diagonal denote the host genes with a higher circRNA TSI than their linear counterparts.




