


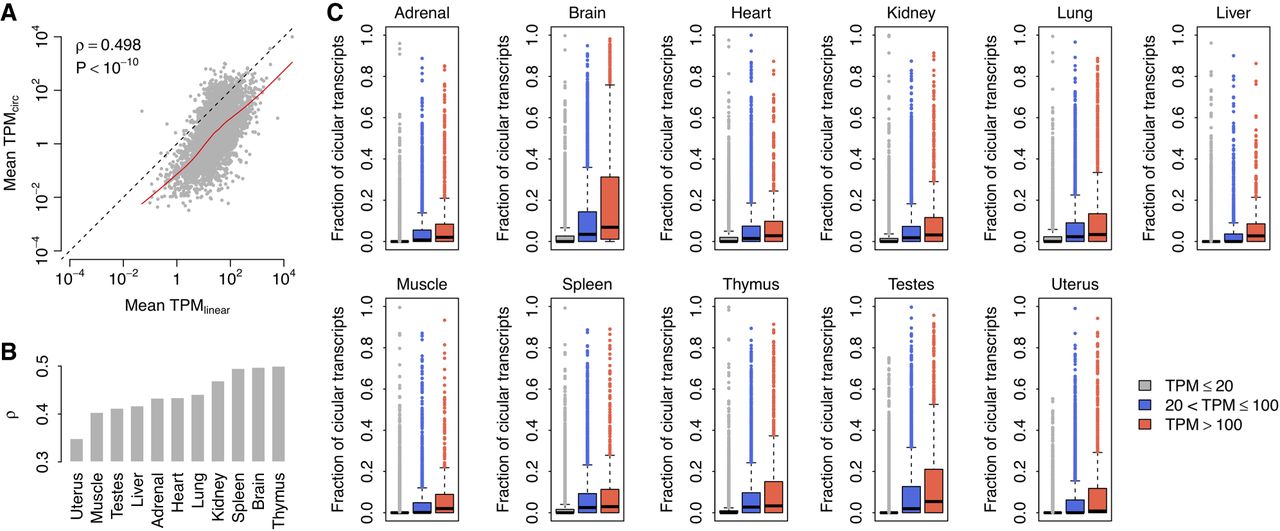
Relationship between the expression of circRNAs and their linear counterparts. (A) Correlation between mean TPMlinear and mean TPMcirc values in the rat brain. Each dot represents one host gene. The dots above the diagonal denote the host genes with higher circRNA expression relative to their linear transcripts in the brain. The red curve represents Lowess smoothed data. The correlation coefficient (ρ) and P-value were calculated with Spearman's rank correlation test. (B) Comparison of the correlation coefficient (ρ) calculated between mean TPMlinear and mean TPMcirc values across the 11 rat tissues by Spearman's rank correlation test. (C) Comparison of the fraction of circular transcripts for genes categorized by expression level.




