


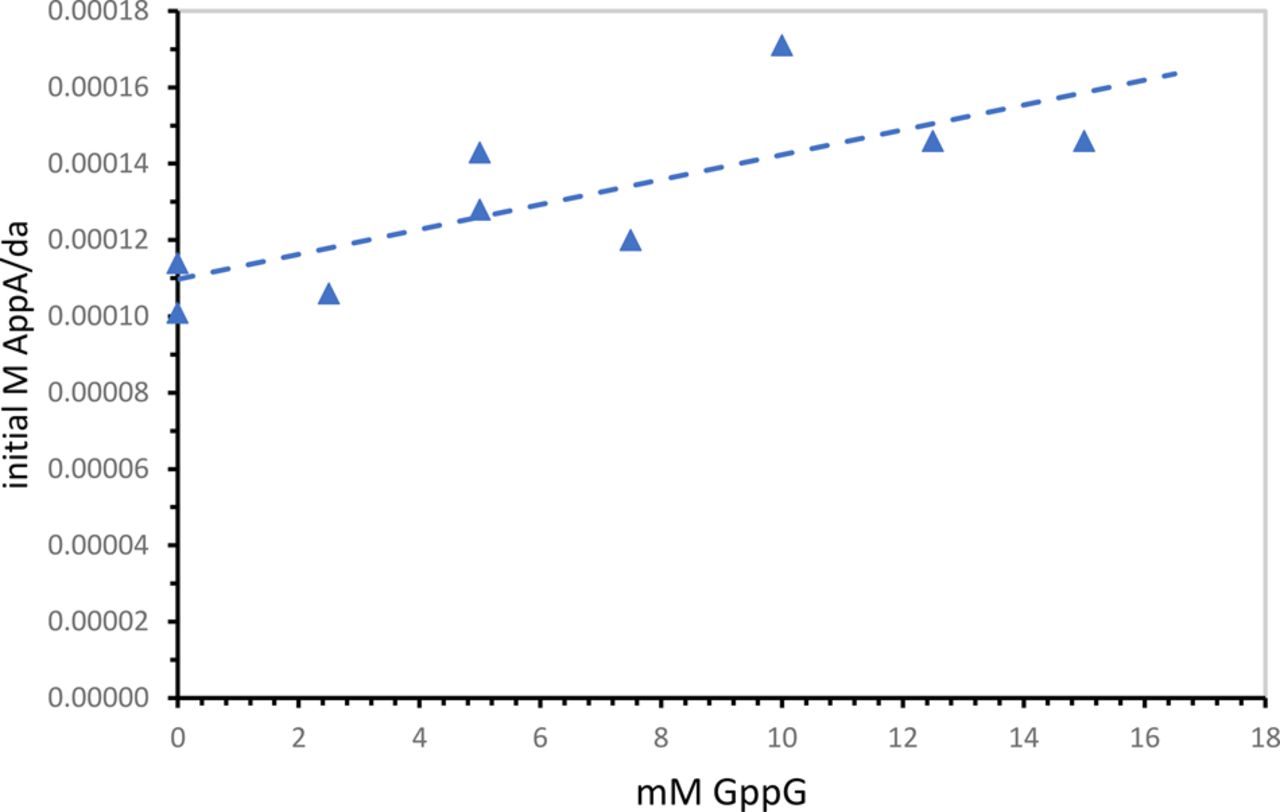
FIGURE 4.
Initial AppA synthesis rates increase with GppG concentration. Here initial rates are determined using 10 mM nucleotides, with GppG varied up to 15 mM molecular concentrations. Thus the y-axis extrapolate defines the chemical reaction rate.




