


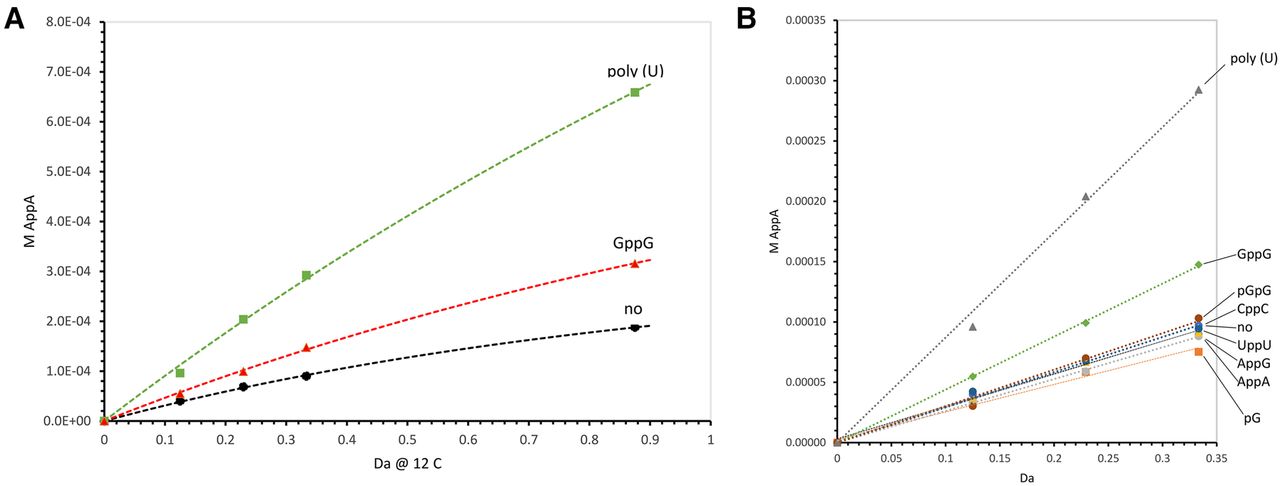
(A) Comparison between the cross-templating synthesis of AppA and the current GppG-templated reaction. [32P]AppA concentration is plotted versus time at 12°. With 10 mM poly(U)—green squares, with 10 mM GppG—red triangles. The curve marked “no” has only nucleotides, no template. Curved dashed lines are calculated least squares fits to experimental points (using the model in Materials and Methods). (B) Early kinetics of AppA synthesis. Reactions contain 10 mM pA, 10 mM 2meImpA, and a trace of [5′ 32P]pA. Least squares linearity of the plots suggests that they yield rates substantially unaffected by 2meImpA decay. Labels at the right resolve superposed data for 10 mM ribodinucleotides or nucleotide tested for template activity. (No) No template, chemical reaction alone. Triangles at the top are poly(U) data.




