


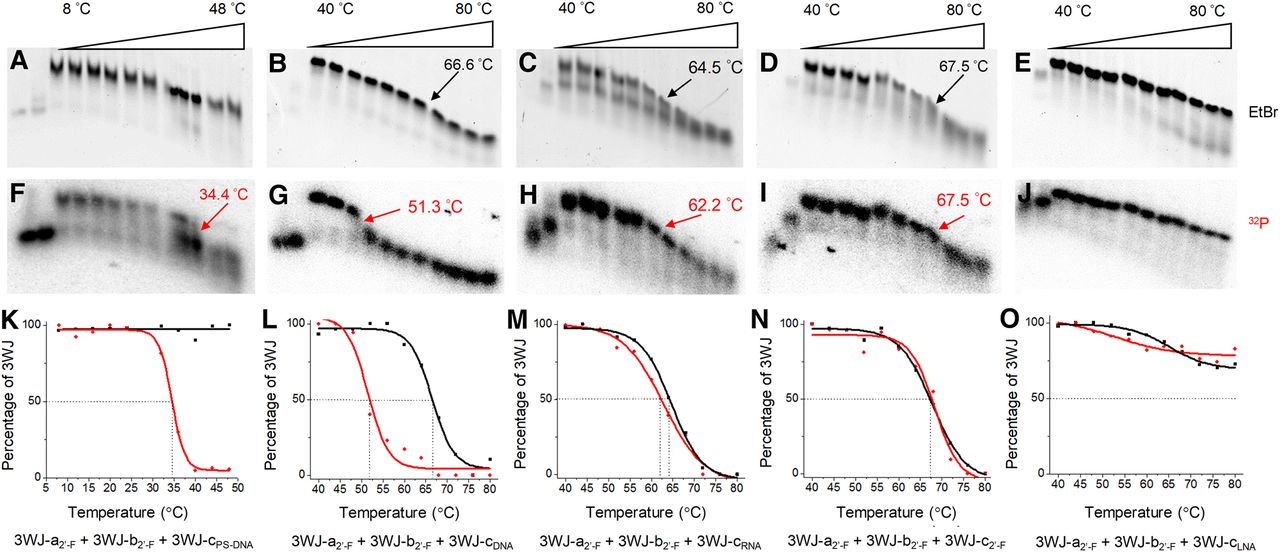
FIGURE 3.
Melting of hybrid 3WJs (3WJ-c is 32P-labeled). The first two lanes of each sample are monomer and dimer as controls. Red curve is melting curve from phosphorimaging; black curve is melting curve from EtBr channel. Red arrow and number indicate Tm of c strand in hybrid 3WJs. Black arrow and number indicate Tm of 3WJ-a2′-F + 3WJ-b2′-F. (A,F,K) Melting of PS-DNA hybrid 3WJ. (B,G,L) Melting of DNA hybrid 3WJ. (C,H,M) Melting of RNA hybrid 3WJ. (D,I,N) Melting of 2′-F homogeneous 3WJ. (E,J,O) Melting of LNA hybrid 3WJ. Bottom graphs are overlap of melting curves of 3WJ-c (phosphorimaging, F–J) and the hybrid 3WJ (EtBr staining, A–E) for each hybrid 3WJ.




