


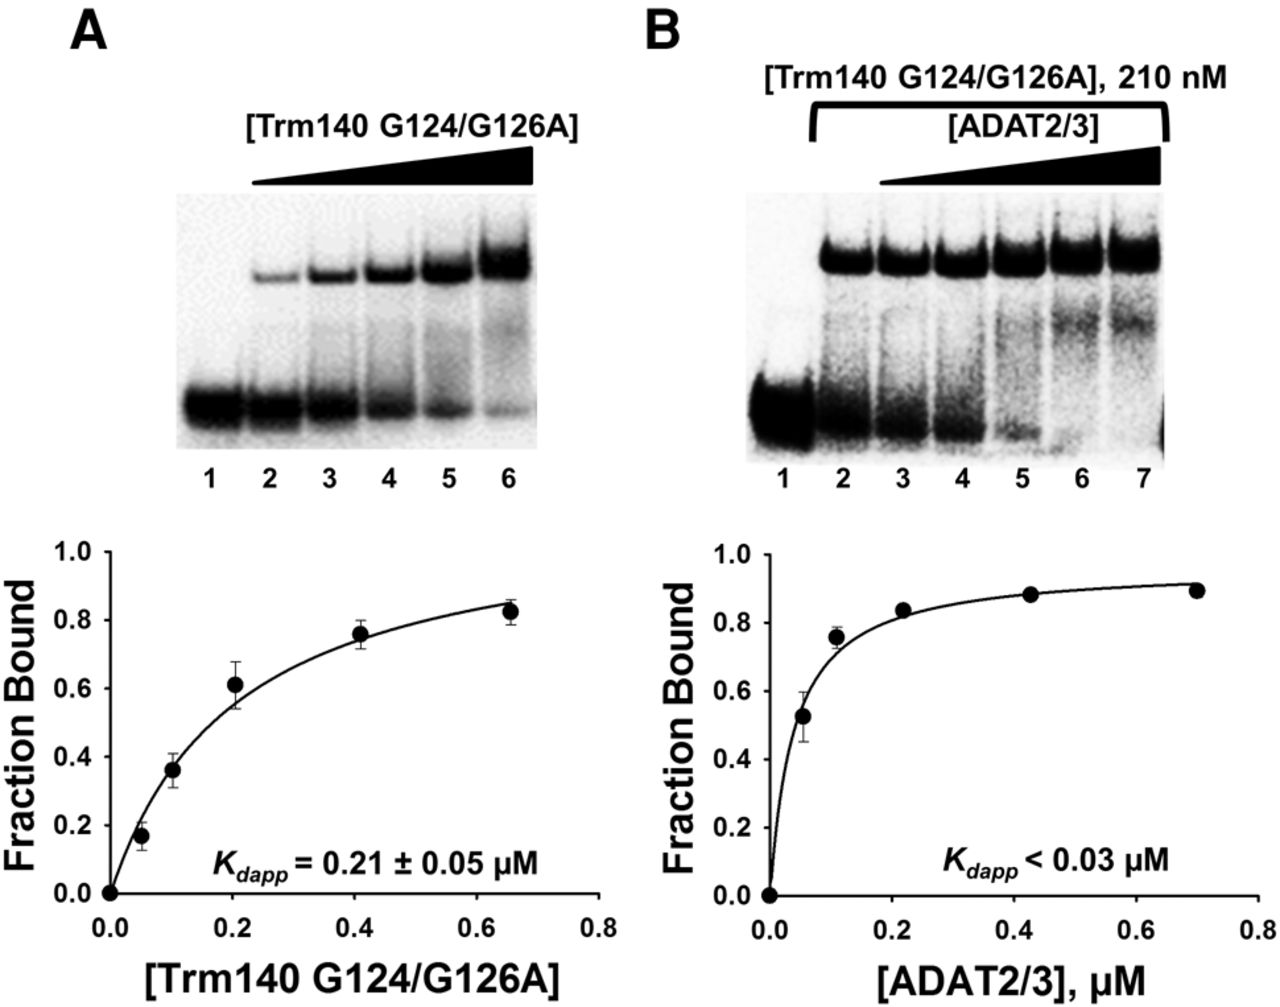
TbTrm140 catalytic residues do not contribute to increased affinity of TbADAT2/3 for tRNA. (A) EMSA of TbTrm140 catalytic mutant (G124/G126A) to tRNAThrCGU. Lane 1 is a no-enzyme control reaction. Lanes 2–6 show an increasing concentration of TbTrm140 catalytic mutant (0.04, 0.08, 0.16, 0.32, and 0.56 µM, respectively). (B) EMSA of TbADAT2/3 to tRNAThrCGU in the presence of the TbTrm140 catalytic mutant. Lanes 1 and 2 show a no-enzyme control reaction and control reaction with no mutant TbTrm140 added, respectively. Lanes 3–7 show an increasing concentration of TbADAT2/3 (0.06, 0.12, 0.24, 0.48, and 0.7 µM, respectively). The bottom panels show the single-ligand binding isotherms used to calculate the individual Kdapp. Each graph represents at least 5 independent replicates.




