


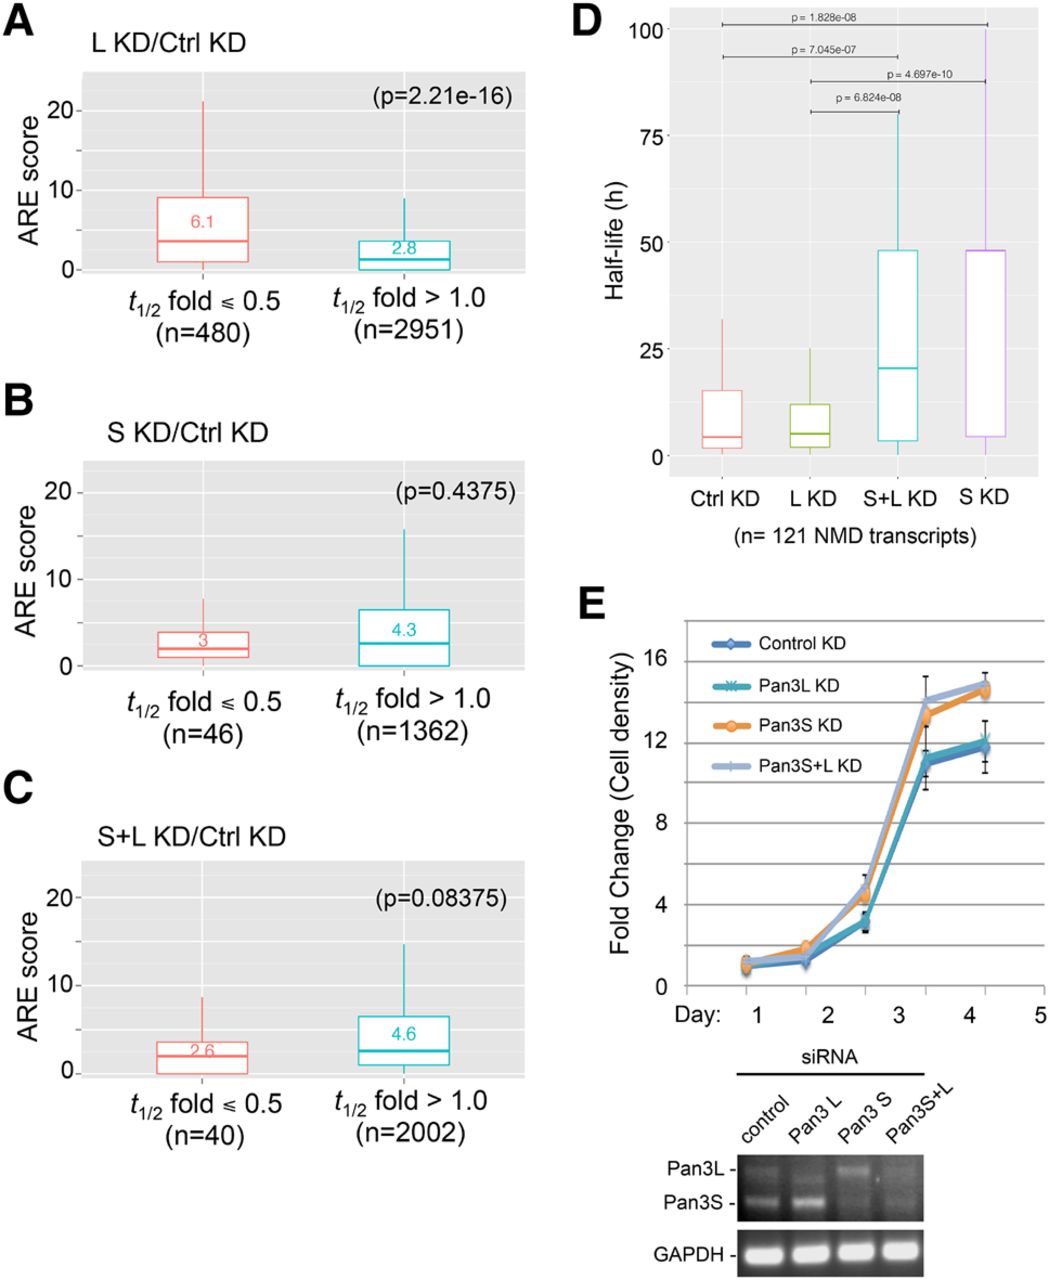
Transcriptome-wide effects of Pan3 isoform knockdowns on individual mRNA decay pathways and cell proliferation. (A–C) Boxplots showing the AREScore distribution of mRNAs after knockdown of Pan3L (A), Pan3S (B), or both Pan3 isoforms (C). The AREScore algorithm (http://arescore.dkfz.de/arescore.pl) was applied to RNA-seq data sets (Supplemental Table S2) to identify ARE-containing mRNAs in each of the knockdown conditions and to quantitate the strength of AREs found in individual transcripts using the default parameters. A t-test was done to access statistical significance. (D) Evaluation of the effects of Pan3 depletion on the NMD pathway in 121 high-confidence NMD substrates that followed first-order decay kinetics under control or Pan3 knockdown conditions (Supplemental Table S2). Changes in average half-life of the NMD transcripts caused by different Pan3 knockdowns are shown by boxplots, of which the statistical significance was assessed by a Wilcoxon test. (E) Cell proliferation assay showing the effects of depleting Pan3 isoforms on cell growth. (Upper) Normalized growth curves of U2OS cells with knockdown of one or both Pan3 isoforms (Pan3L KD, Pan3S KD, or Pan3S+L KD) or with control knockdown (mean ± SD; n = 8). (Lower) RT-PCR and gel electrophoresis were used to assess the knockdown efficiency; GAPDH served as the control.




