


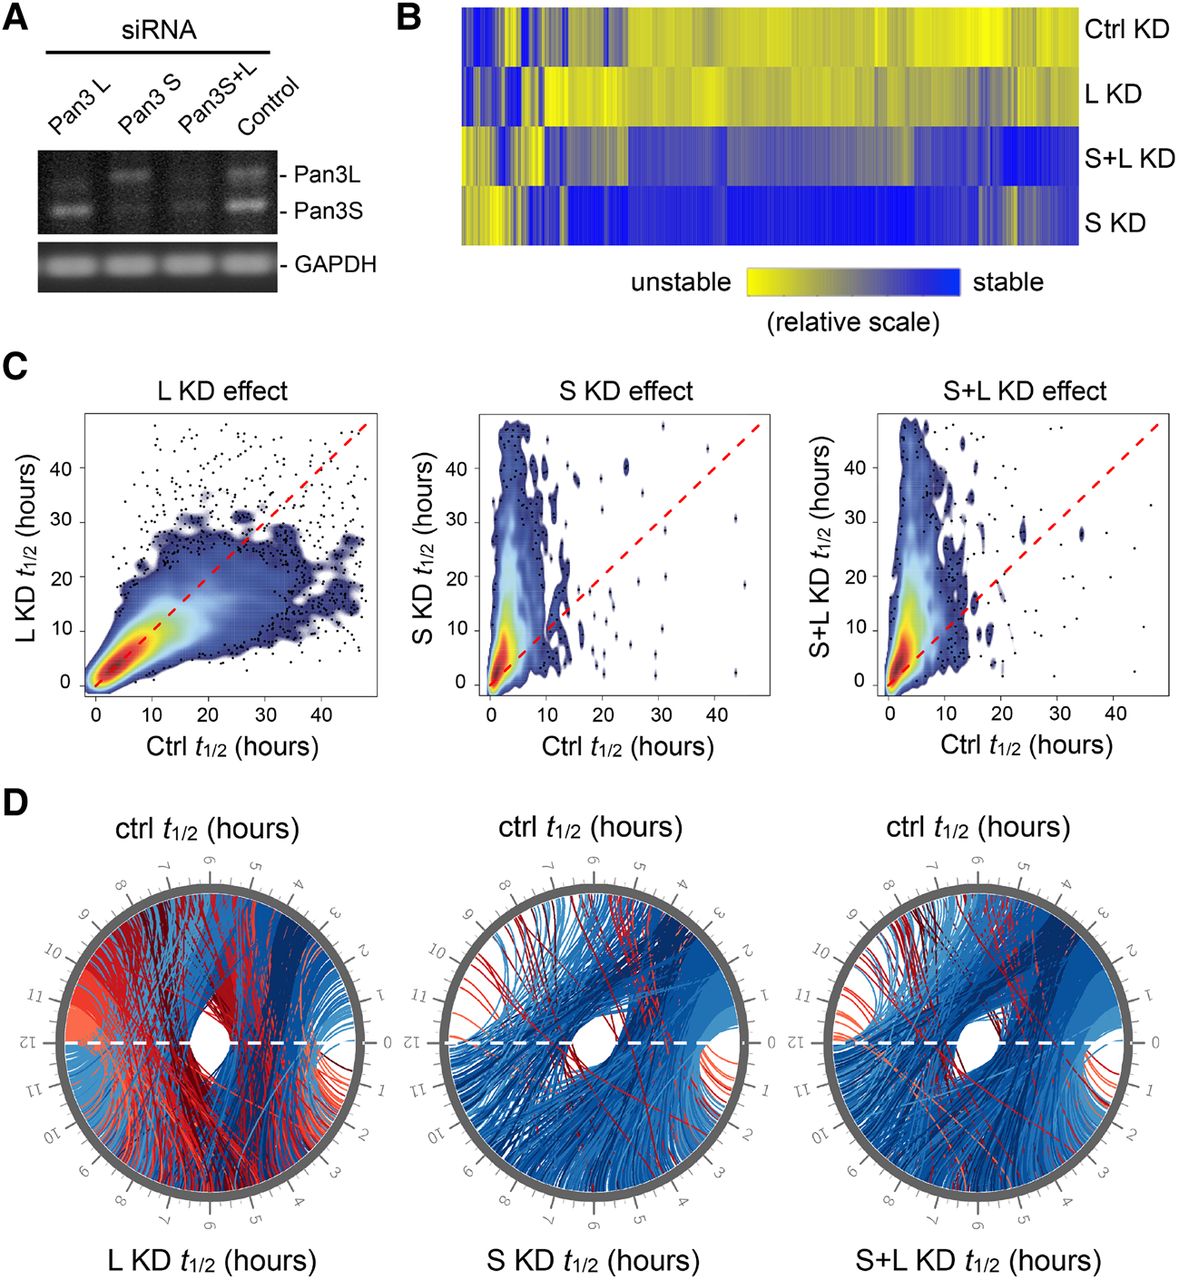
Effects of Pan3 knockdowns on global mRNA turnover. (A) RT-PCR and agarose gel electrophoresis were used to assess the Pan3 knockdown efficiency in human U2OS cells; GAPDH mRNA served as loading control. (B) A heat map illustrating differential effects of knocking down different Pan3 isoforms on mRNA stability across the transcriptome. A color-gradient scale (relatively short half-life in yellow; relatively long half-life in blue) depicts the changes in half-life of each gene under different Pan3 isoform knockdown conditions compared with the half-life of the corresponding gene in the control knockdown (Ctrl KD) cells. The genes whose transcripts were degraded following strong first-order kinetics under all four knockdown conditions (Supplemental Table S3) are included in this analysis. (C) Combined scatter and density plots showing effects of knocking down Pan3L (left), Pan3S (middle), or both Pan3L and Pan3S (right) on mRNA stability across the transcriptome. The genes whose transcripts were degraded following strong first-order kinetics under each knockdown condition (Supplemental Table S2) are included in the analyses shown in C and D. (D) CIRCOS plot representations showing effects of knocking down different Pan3 isoforms on global mRNA turnover. The half-lives (t1/2) in the control condition (Ctrl) are plotted at the top half of the circle, and those obtained from Pan3L knockdown (L KD), Pan3S knockdown (S KD), or knocking down both Pan3 isoforms (S+L KD) are plotted at the bottom half of the circle. Each line represents a change in half-life of an mRNA, with the red or blue colors indicating that the mRNAs are destabilized or stabilized by Pan3 knockdown, respectively.




