


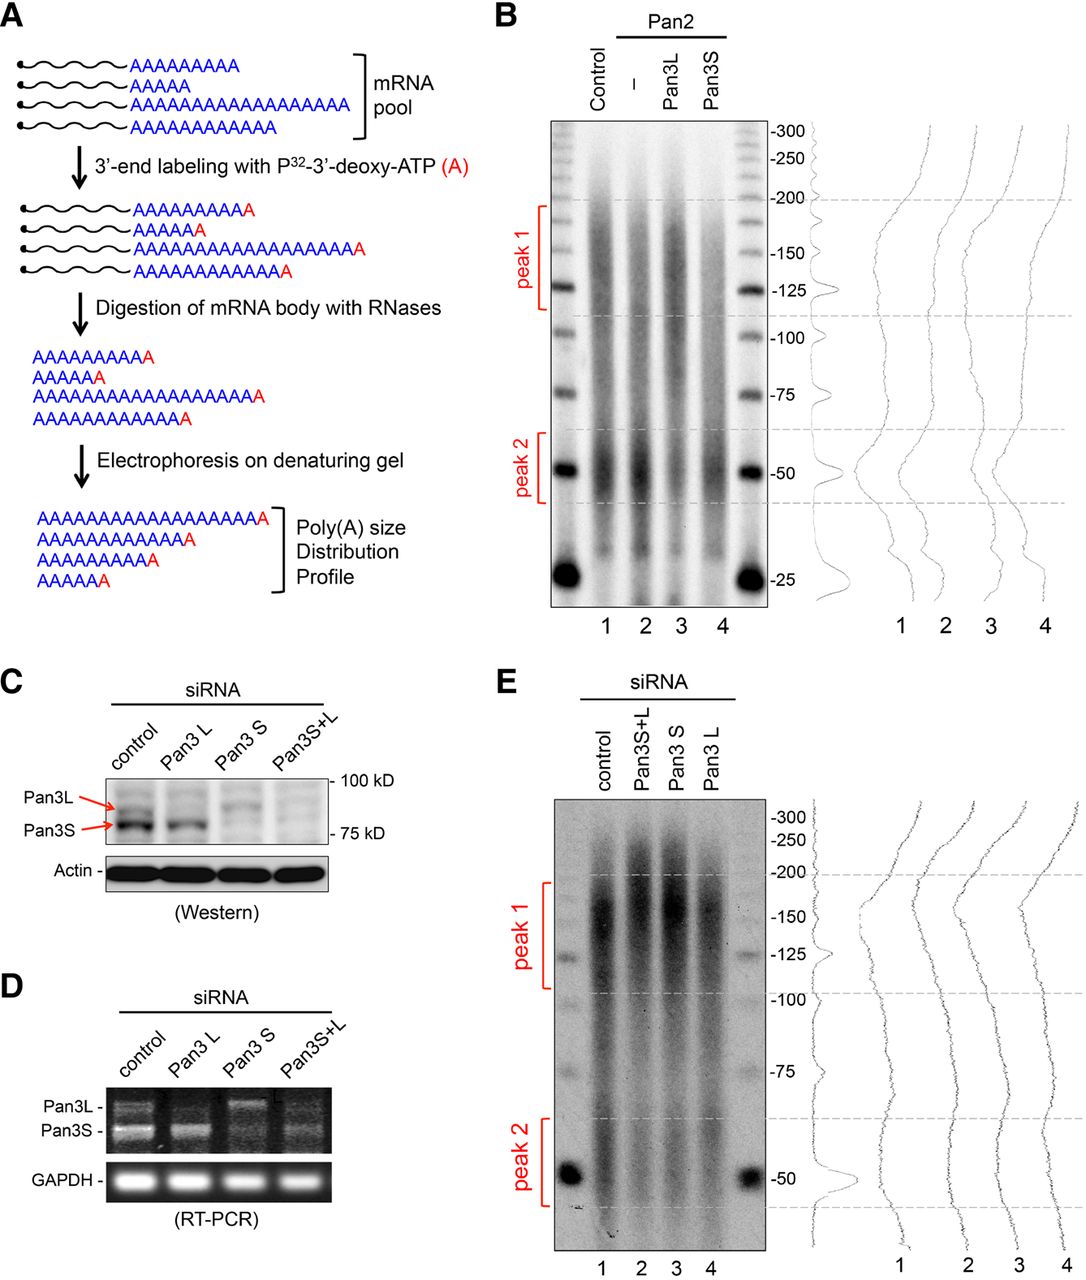
Pan3S and Pan3L exhibit differential effects on global mRNA deadenylation. (A) Schematic diagram showing the experimental procedure of poly(A) size distribution profiling. (B) Denaturing gels showing changes in the poly(A) length-distribution profile of the entire mRNA population accompanying ectopic expression of HA-Pan2 with or without individual Pan3 isoforms. Total cytoplasmic RNA samples were collected from the same sets of cells used for the experiment shown in Figure 3A. (C–E) Human BEAS-2B cells were treated with control siRNA, Pan3L-specific siRNA, Pan3S-specific siRNA, or both Pan3 siRNAs (Pan3S+L). The knockdown efficiency was evaluated by Western blot (C) and RT-PCR analyses (D); actin protein or GAPDH mRNA served as the respective loading control. The effects of Pan3 isoform knockdowns on poly(A) size distribution of the entire mRNA population were analyzed by denaturing gel electrophoresis (E). Red brackets (B,E) indicate peak 1 and peak 2, two major fractions of steady-state mRNAs from the control cells that result from the first and second phases of deadenylation, respectively. The poly(A) size distribution profiles (right panels of B,E) were obtained by scanning each lane of the gels using ImageJ software.




