


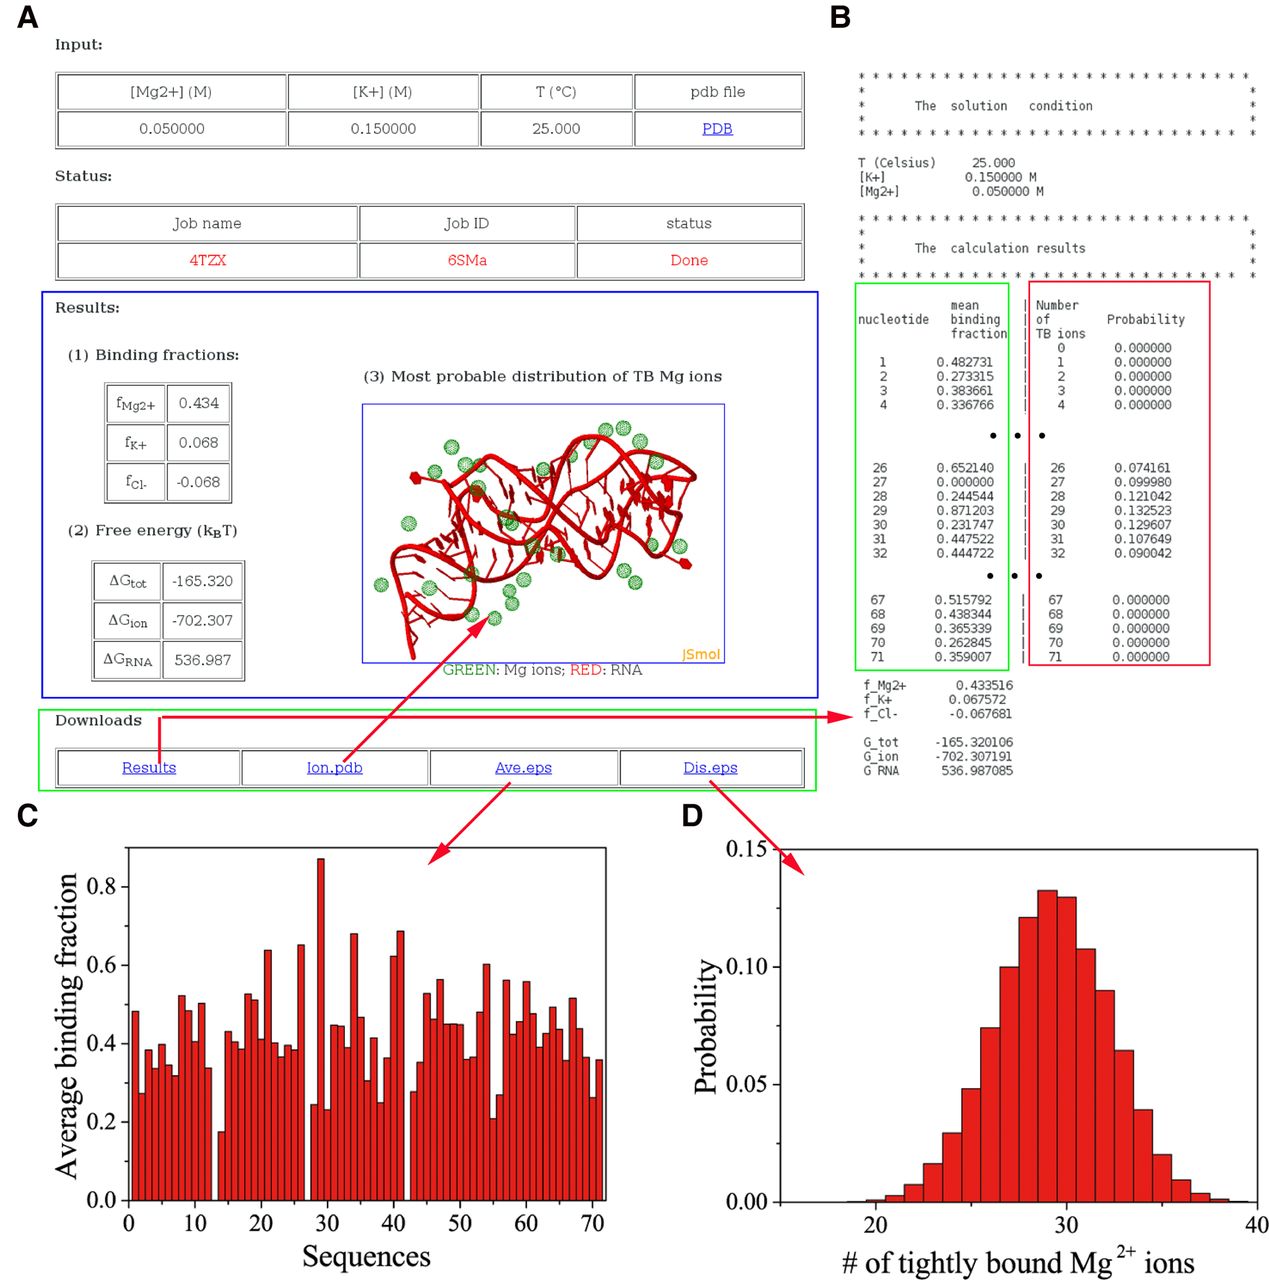
FIGURE 3.
(A) The web page that shows the results. (B) An example of the data text file, including the solution condition and calculation results. (C) The average binding fraction of TB Mg2+ ions for each nucleotide. (D) The probability distribution of the number of the TB Mg2+ ions.




