


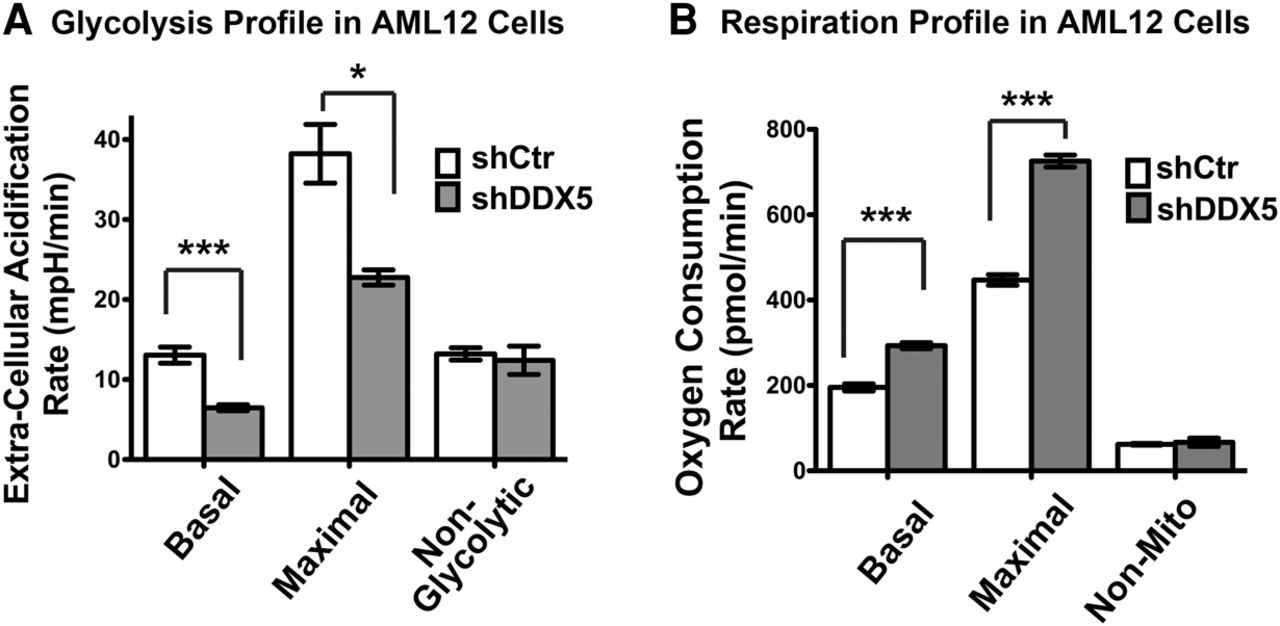
DDX5 promotes glycolysis in mammalian cells. (A) Metabolic profiles of AML12 mouse hepatocytes with DDX5 knockdown reveals defects in glycolytic capacity. The glycolysis profiles of cells expressing shDDX5 or shCtr were analyzed using the Seahorse XFe24 Analyzer as previously described (Chen et al. 2016). Extracellular acidification rate, which correlates with the rate of glycolysis, was measured following addition of compounds that trigger various stages of glycolysis. The first injection is glucose that induces glycolysis. The second injection is oligomycin, an ATP synthase inhibitor that abolishes mitochondrial ATP production and thus shifts the energy production to glycolysis (Hao et al. 2010), revealing the maximum glycolytic capacity. The final injection is 2-deoxy-d-glucose, which competitively inhibits glucose hexokinase and blocks glycolysis (Brown 1962). The basal, maximal, and nonglycolytic acidification rates were determined using the Seahorse XF Stress Test Report Generator (Seahorse Bioscience). (B) DDX5 knockdown increases respiration in AML12 cells. The respiration profile of AML12 cells was analyzed by measuring the oxygen consumption rates at basal levels and following injection of compounds that target the electron transport chain. Oligomycin decreases basal respiration (Hao et al. 2010). FCCP (carbonyl cyanide-p-(trifluoromethoxy) phenylhydrazone) is an uncoupling agent that dissipates proton gradient (Park et al. 2002); as a result, oxygen is maximally consumed. The third injection is rotenone and antimycin A, which shuts down mitochondrial respiration and enables the calculation of nonmitochondrial respiration. Respiration rates were determined using the Seahorse XF Stress Test Report Generator. All data are shown as the mean ± SD of three independent biological replicates. (*) P-value <0.05, (***) P-value <0.001.




