


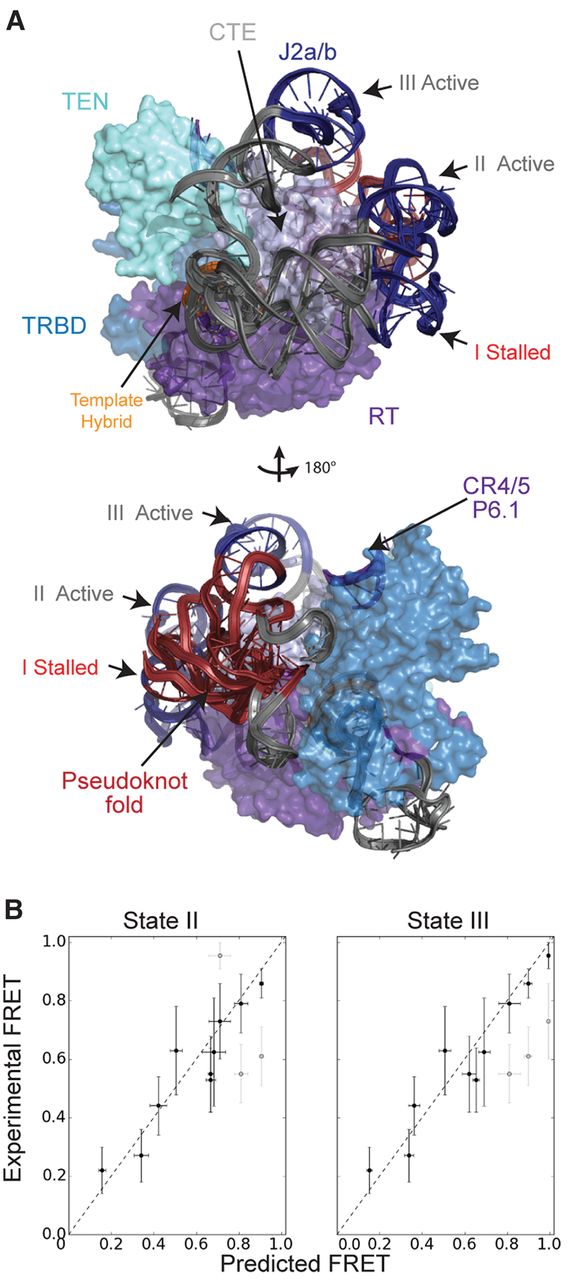
Single-molecule FRET-Rosetta predicts activity-induced motion of the core domain around the C-terminal element. (A) Three distinct RNA states emerged from the modeling when using both the stalled and active data. State I is produced when telomerase is modeled with the stalled data (red histograms, Fig. 2). States II and III are a result of modeling the RNP with the active data (gray histograms, Fig. 2). Both states II and III show a rotation of the pseudoknot fold around the complex away from its original stalled position of state I. (B) Distances were measured in top scoring models from clusters representing each of the states, then converted to FRET values and averaged. These averages are plotted with the standard deviations shown as the error bars in the x-direction. Error bars in the y-direction are the standard deviations of the peaks from the experimental FRET histograms. Separate points are shown for each of the U92–U312, U57–U312, and U42–U184 peaks in the states II and III plots. The unsatisfied peaks in each of these plots are shown in light gray. The difference between states II and III is due to the two U92–U312 FRET peaks in the activity data. Strong correlation between the experimental FRET and predicted FRET confirms that the models satisfy all the distance constraints.




