


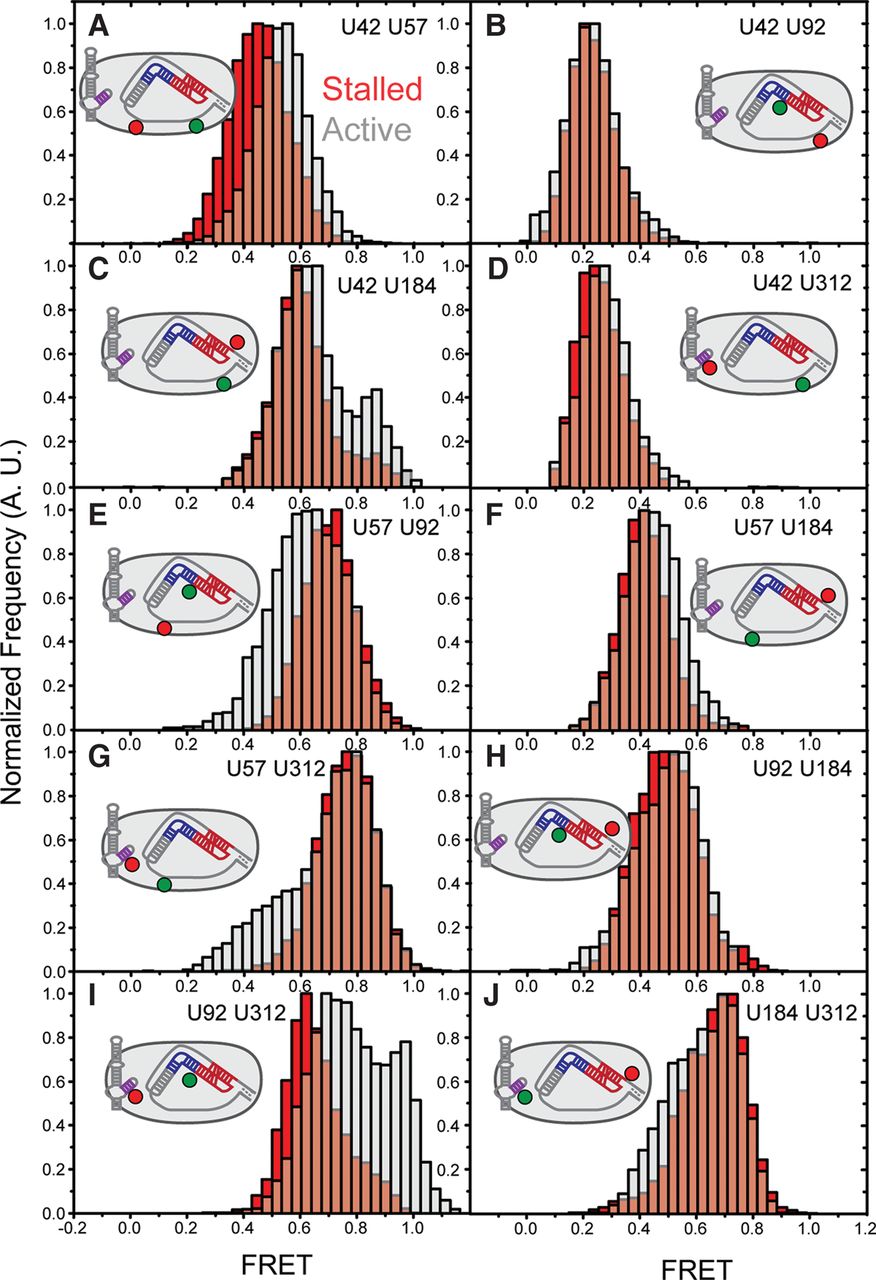
Telomerase activity modulates RNA conformation inducing multiple FRET changes. (A−J) Each panel represents reconstructed FRET histograms generated by compiling single-molecule traces. The FRET label sites are listed in plain text in the panel and depicted in the 2D schematic of telomerase. Red distributions were obtained by binding individual telomerase complexes to 5′-Bio-(TG)6TTAGGG-3′, capturing time resolved traces and then binning the corrected data into a histogram. Gray histograms represent exposure of the telomerase complexes to telomerase activity buffer, followed by similar data collection and analysis. All histograms were generated from at least 50 molecules that exhibited the proper photo-bleaching events for photo-physical correction.




