


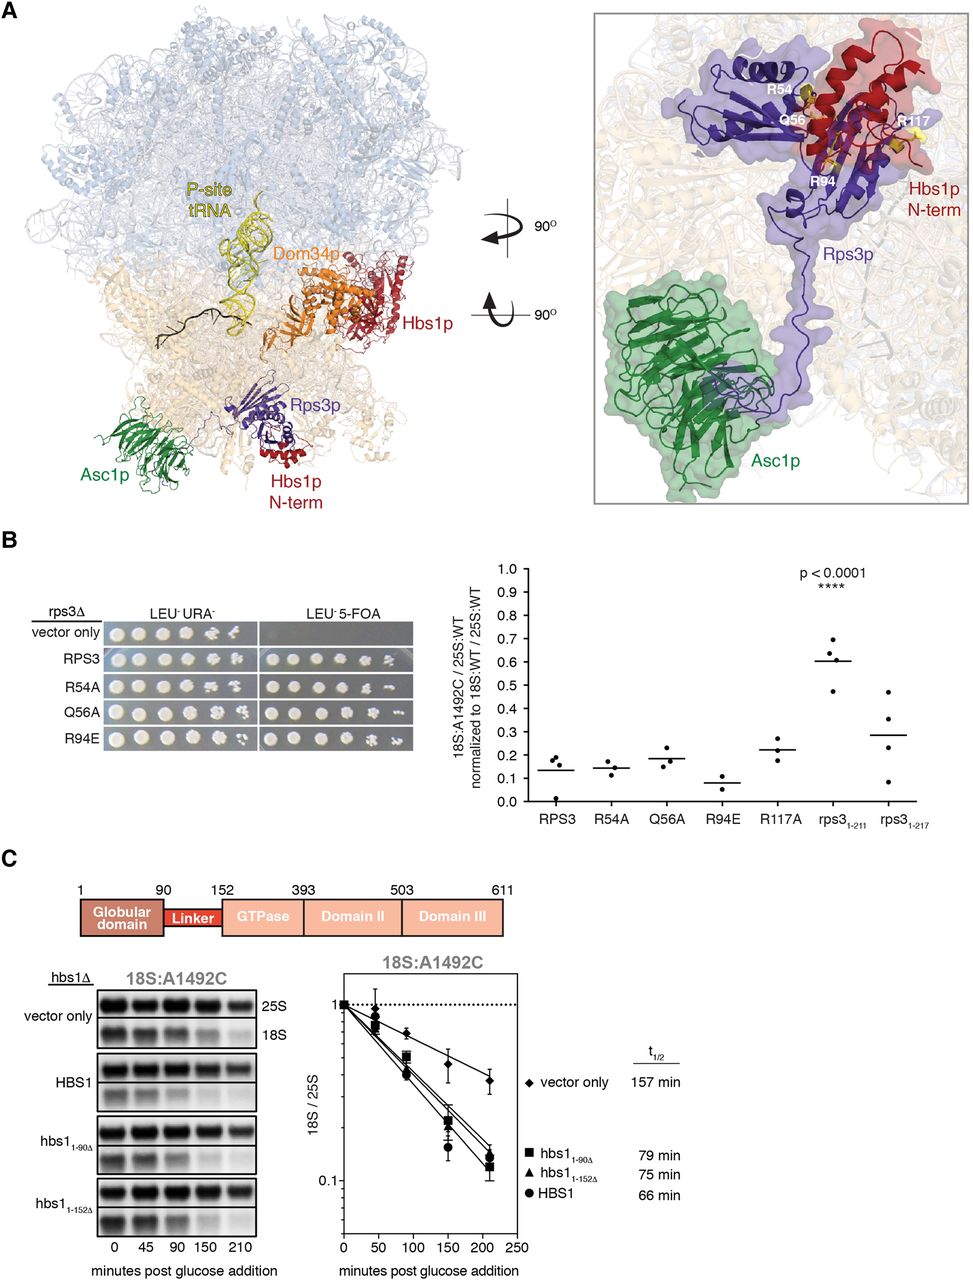
(A, left) Cryo-EM structure of the yeast 80S ribosome in complex with Dom34p:Hbs1p (orange:red), P-site tRNA (yellow), and nonstop mRNA (black) (PDB: 5M1J) (Hilal et al. 2016). Also highlighted are Asc1p (green) and Rps3p (purple). (Right) Close-up of the Hbs1p:Rps3p:Asc1p interaction. Positions of Rps3p point mutations at the Hbs1p:Rps3p interface are shown in yellow. Note that amino acids 3–225 of Rps3p have been resolved (full-length: 240). (B, left) Plasmid shuffle experiment showing growth of strains (10-fold dilution series) harboring plasmids expressing wild-type RPS3 or indicated point mutations on a LEU−URA− or LEU−5-FOA plate. (Right) Single time-point analyses of tagged 18S and 25S rRNAs. For all strains, 18S:A1492C/25S:WT ratio was normalized to the 18S:WT/25S:WT ratio. Error bars represent standard error of the mean. One-way ANOVA with planned comparisons was used for significance testing comparing all rps3 variant strains against the wild-type RPS3 strain; only rps31-211 was statistically different (P < 0.0001). (C) Diagram of Hbs1p domains (top) and time course analysis of 18S:A1492C in hbs1 strains (bottom). Data normalization as in Figure 1B and C. Representative Northern blots and graph of time course data with indicated 18S:A1492C rRNA half-lives. Error bars represent standard error of the mean (n = 2).




