


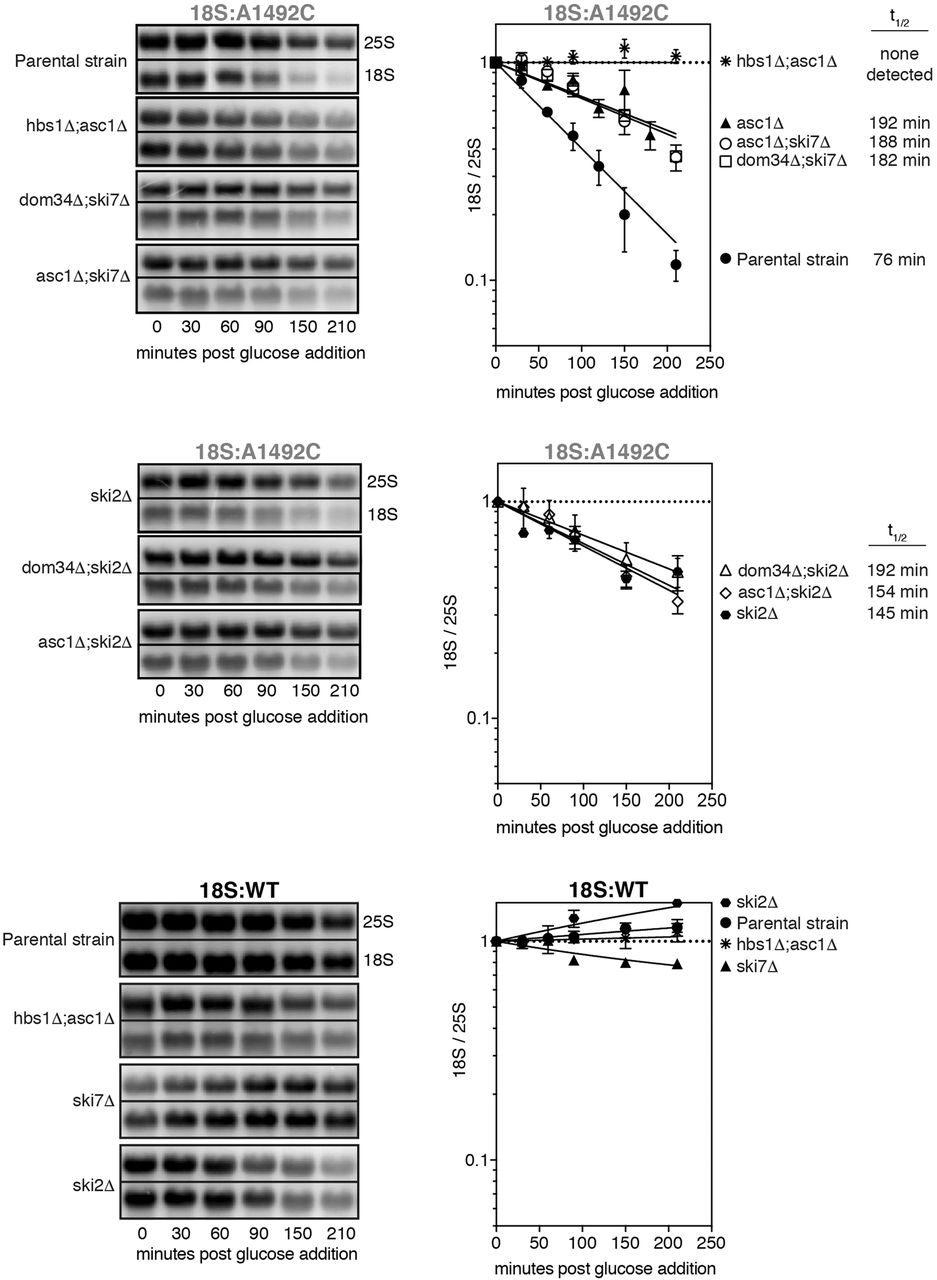
FIGURE 4.
Time course analysis of 18S:A1492C and 18S:WT in single and double deletion strains. Representative Northern blots of tagged 18S:A1492C and 25S rRNAs and graphs summarizing multiple (n = 2–3) biological replicates. Normalization and error bars as in Figure 1B and C. 18S:A1492C data from the parental and asc1Δ single deletion strains are the same as in Figure 1B (parental) and Figure 2B (asc1Δ).




