


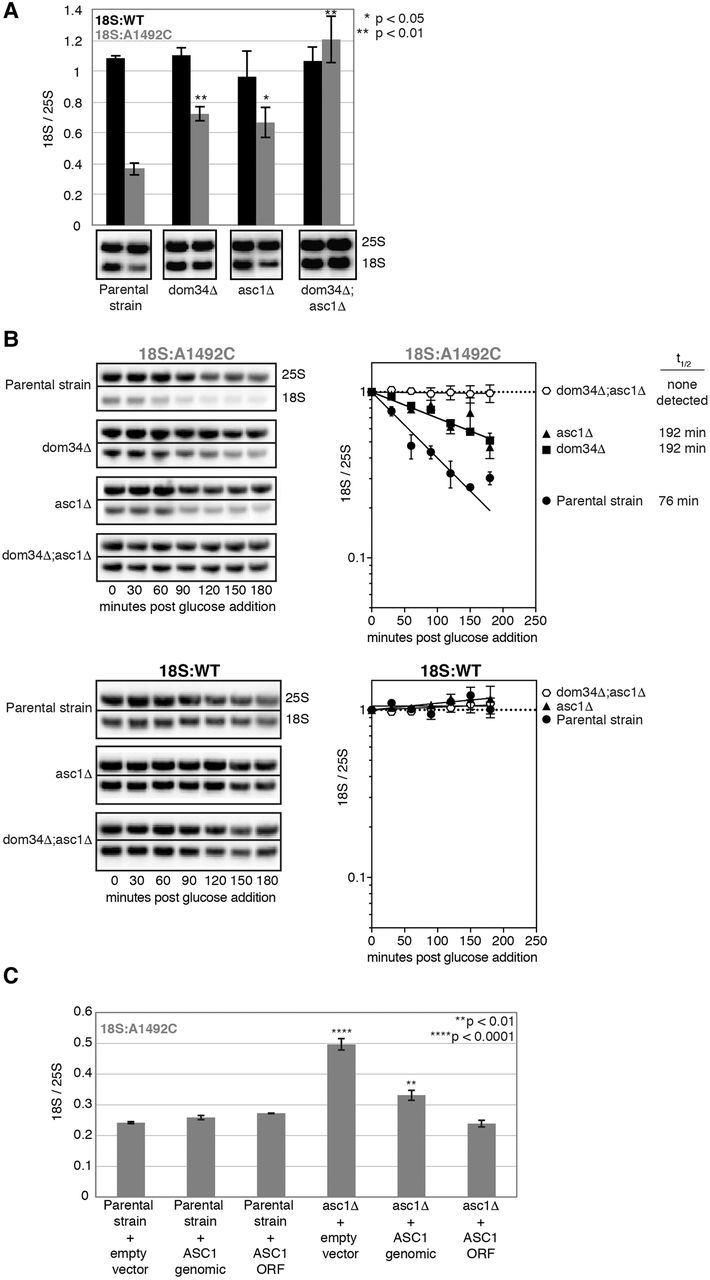
(A) Single time-point analysis of tagged 18S and 25S rRNAs. One-way ANOVA with planned comparisons was used for significance testing comparing the parental strain and each single deletion 18S:A1492C/25S:WT ratio. Unpaired t-test was used to compare the parental strain and dom34Δ;asc1Δ 18S:A1492C/25S:WT ratios. Error bars represent standard error of the mean (n = 3). (B) Time course analysis of 18S:A1492C and 18S:WT decay in dom34Δ and asc1Δ single and double deletion strains. Representative Northern blots of tagged 18S:A1492C and 25S rRNAs and graphs summarizing multiple (n = 3) biological replicates. Normalization and error bars as in Figure 1B and C. (C) Single time-point analysis of tagged 18S:A1492C rRNA in parental and asc1Δ strains harboring indicated plasmids. One-way ANOVA with planned comparisons was used for significance testing of all strains against the “Parental strain + empty vector” strain. Error bars represent standard error of the mean (n = 3).




