


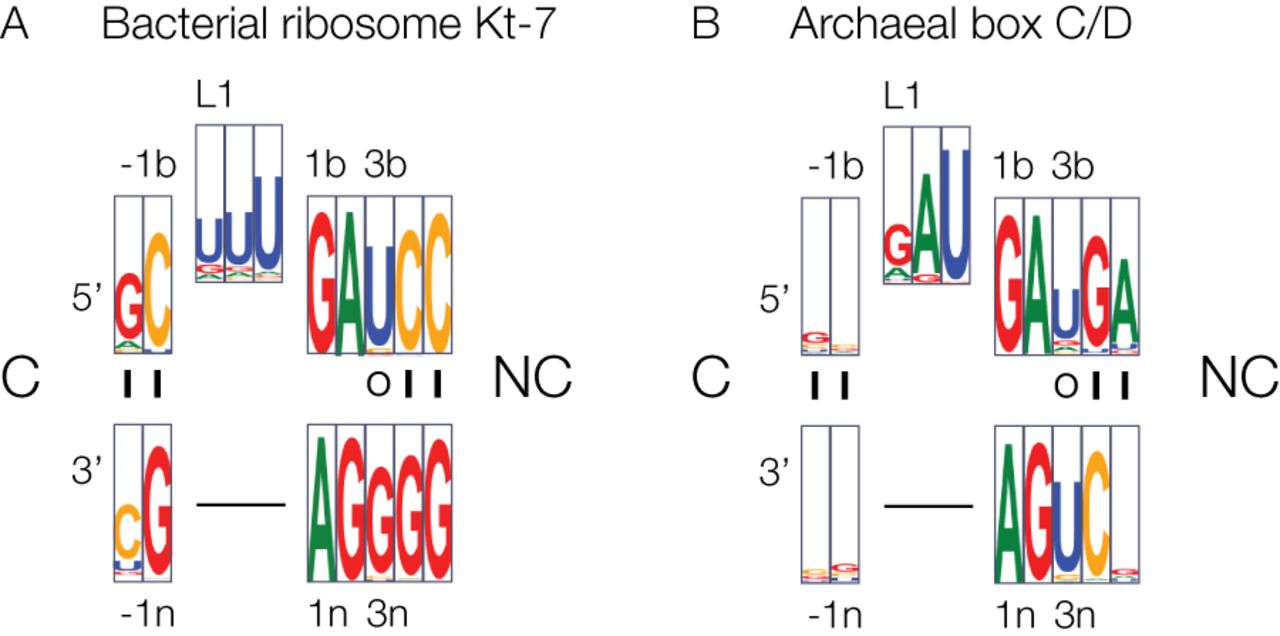
FIGURE 5.
Bioinformatic analysis of nucleotide frequencies within bacterial ribosomal Kt-7 and archaeal box C/D k-turns. These data are presented in the form of WebLogo plots (Crooks et al. 2004) where the size of the letters is proportional to the frequency of that nucleotide at a given position. A similar analysis of the human box C/D k-turns made previously is similar to the archaeal plot shown here.




