


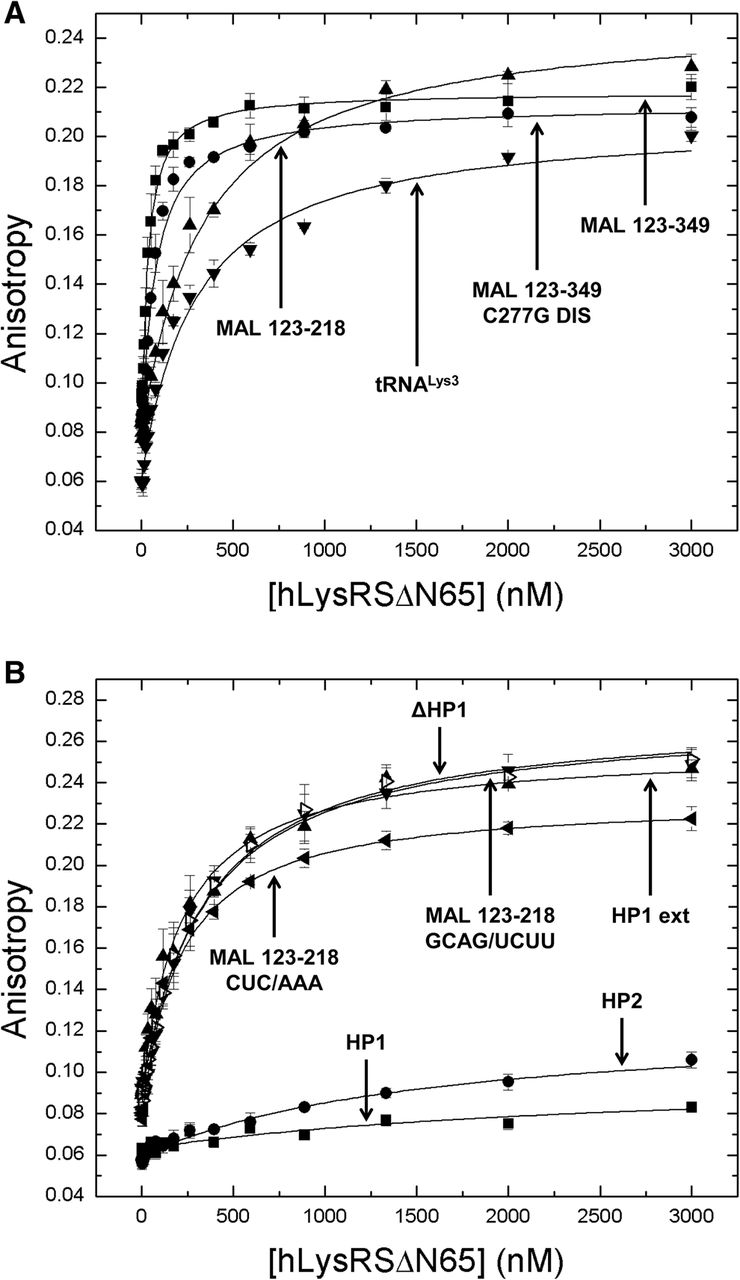
FIGURE 3.
Fluorescence anisotropy assay of (A) WT and C277G MAL 123–349, MAL 123–218, and tRNALys3 and (B) HP1, HP2, HPI ext, ΔHP1, MAL 123–218 CUC/AAA, and MAL 123–218 GCAG/UCUU binding to hLysRSΔN65. The points represent the average of three experiments, and the lines represent the best fit to a 1:1 binding equation, with standard deviations shown.




