


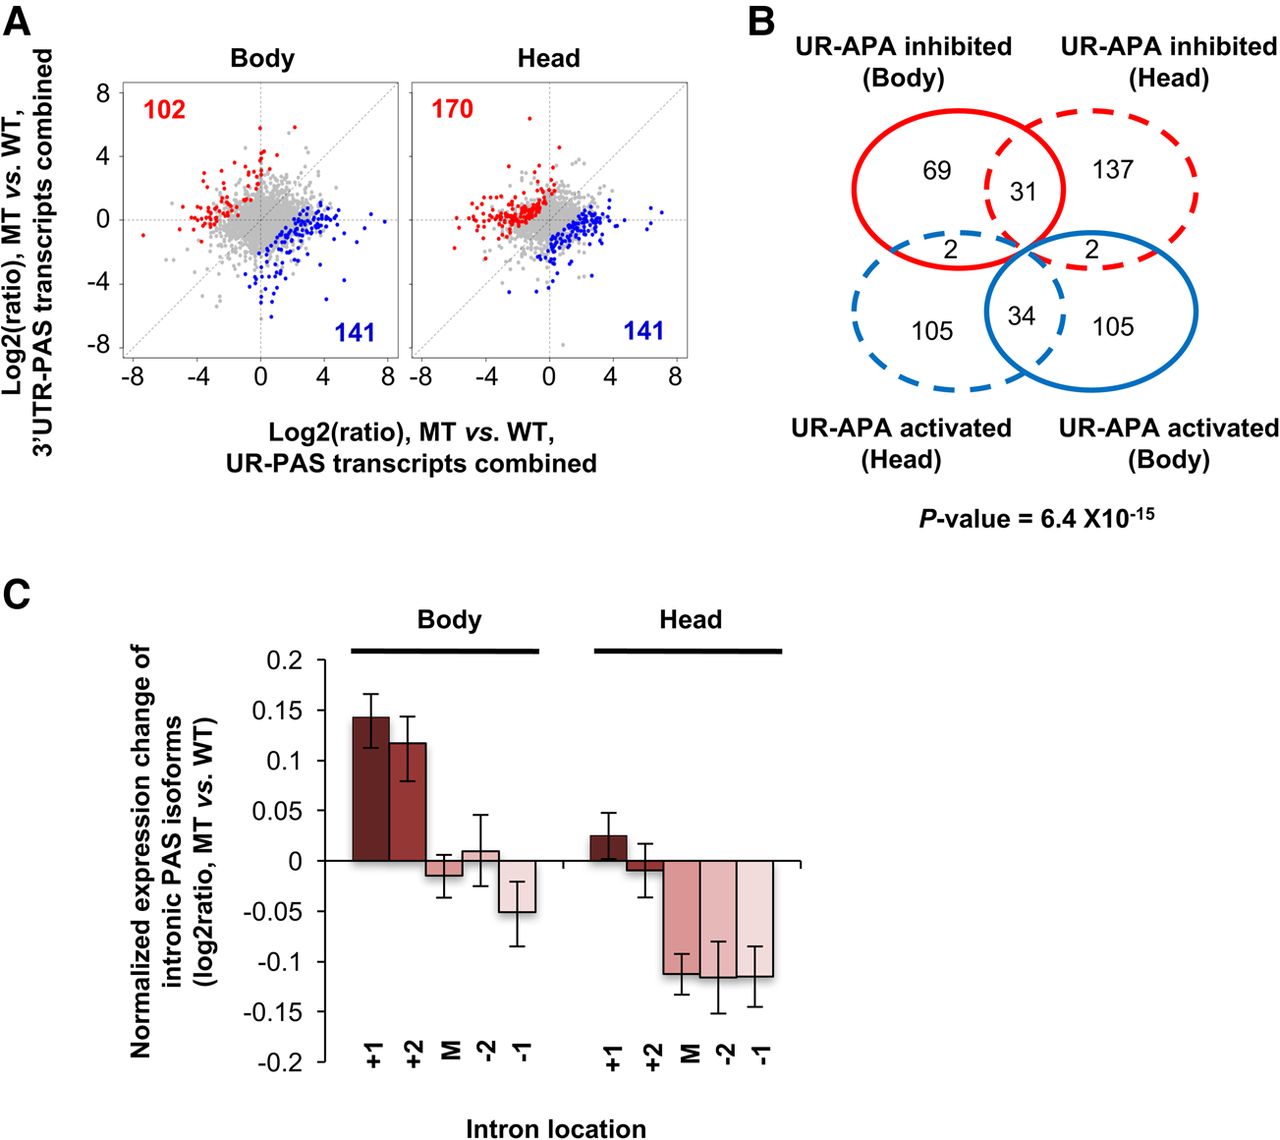
FIGURE 6.
UR-APA regulation in a fly mutant with slower RNAPII elongation. (A) Scatterplot comparing UR-APA and 3′-most exon APA isoform abundance between wild-type (WT) and mutant (MT) in body (left) and head (right), as in Figure 4B. (B) Venn diagram comparing UR-APA changes between WT and MT in body vs. head. Two biological replicates were used for the analysis. (C) Expression difference in intronic APA isoforms between body and head in different intron groups, as in Figure 4D.




